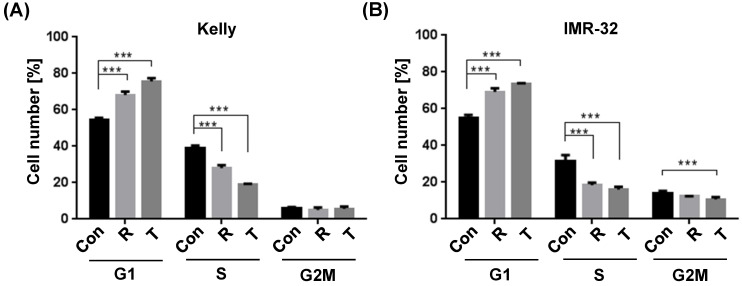
Figure 1.
Cell cycle analysis comparing Rapamycin (R) and Torin-2 (T) at the corresponding IC50 concentrations in neuroblastoma cell line (A) Kelly [R: 30 μM, T: 12 nM] and (B) IMR-32 [R: 40 μM, T: 30 nM]. Con: DMSO-treated control cells. G1-, S-, and G2M cell cycle phases. Cells were seeded 24h before treatment with Rapamycin and Torin 2, respectively, and DMSO concentrations applied as vehicle for control cells. After an incubation of 72h, the cells were harvested, prepared and stained following the univariate cell cycle analysis protocol for the MACSQuant® Analyzer (Miltenyi) with minor changes described in Materials and Methods.

