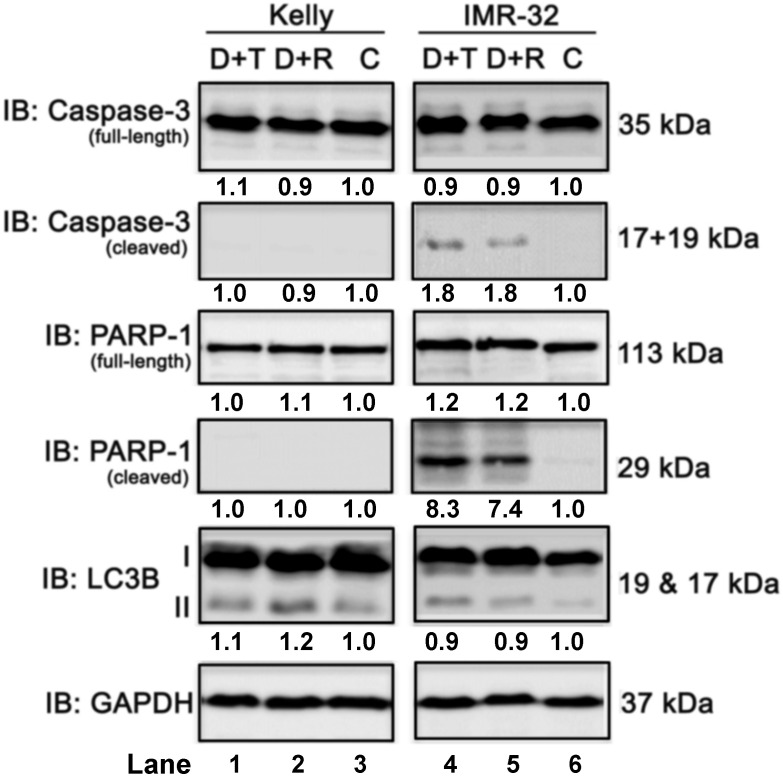
Figure 7.
Immunoblot (IB) analysis of apoptosis (caspase-3 and PARP) and autophagy (LC3B) marker expression comparing Dasatinib combined with Torin-2 (D+T) or Rapamycin (D+R) treatment for 72h in neuroblastoma cell line Kelly and IMR-32. C: Vehicle (DMSO)-treated control cells. GAPDH served as loading control. Numbers below bands state protein expression normalized to GAPDH. Numbers below bands of autophagy marker LC3B represent the ratio between LC3B-II/I. Cells were seeded 24h before drug treatment with a combination of Dasatinib with Torin-2 or Rapamycin, respectively. Drug concentrations used for the combination treatments in Kelly [D+T = 1.5 μM + 9 nM; D+R = 5 μM + 2 μM;] and IMR-32 [D+T = 1 μM + 6 nM; D+R = 0.05 μM + 0.13 μM]. Cells were harvested 72h after treatment.

