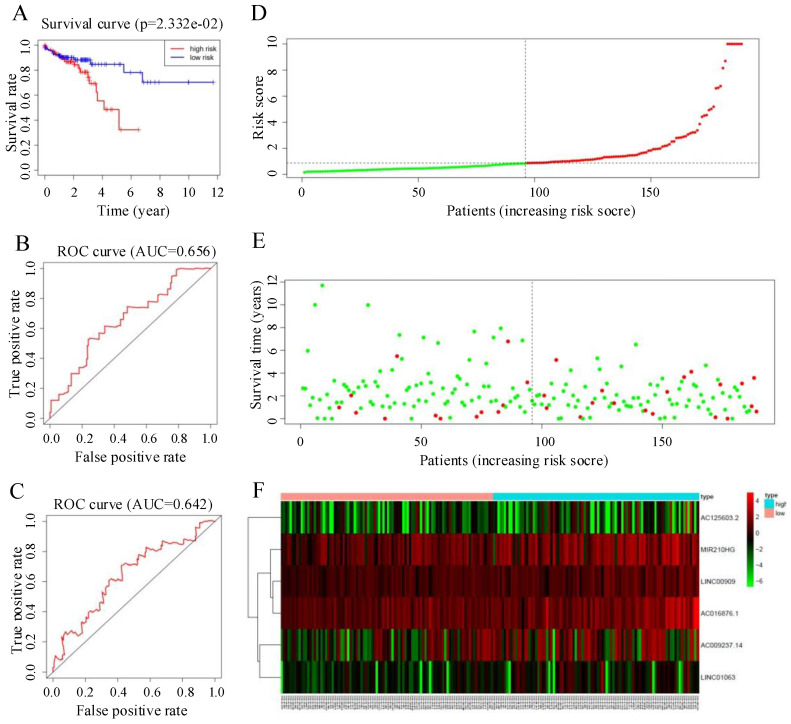
Figure 5.
(A) Kaplan-Meier curves for the test group. (B, C) Time-dependent receiver operating characteristic (ROC) curves for overall survival prediction at 1 year (B) and 3 years (C) in the test group. (D) Distribution of patients with high risk score (red) and low risk score (green) in the training set. (E) Survival status of colorectal cancer patients (red dots represent fatalities, green dots represent survival) in the training set. (F) Heatmap of six key prognostic lncRNAs in the test set.

