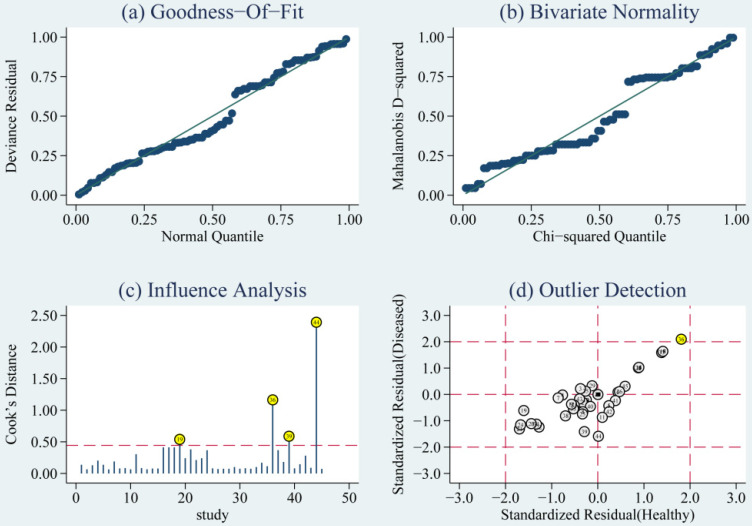
Figure 5.
Diagram of (a) Goodness-of-fit, (b) Bivariate normality, (c) Influence analysis, and (d) Outlier detection. Goodness-of-fit and Bivariate normality showed that random effects bivariate model is suitable. Influence analysis identified that studies of Pietro et al, Yang et al. and O'Connell et al were the most dominant studies in weight. Outlier detection implied that no research is the reason for heterogeneity.

