Figure 3.
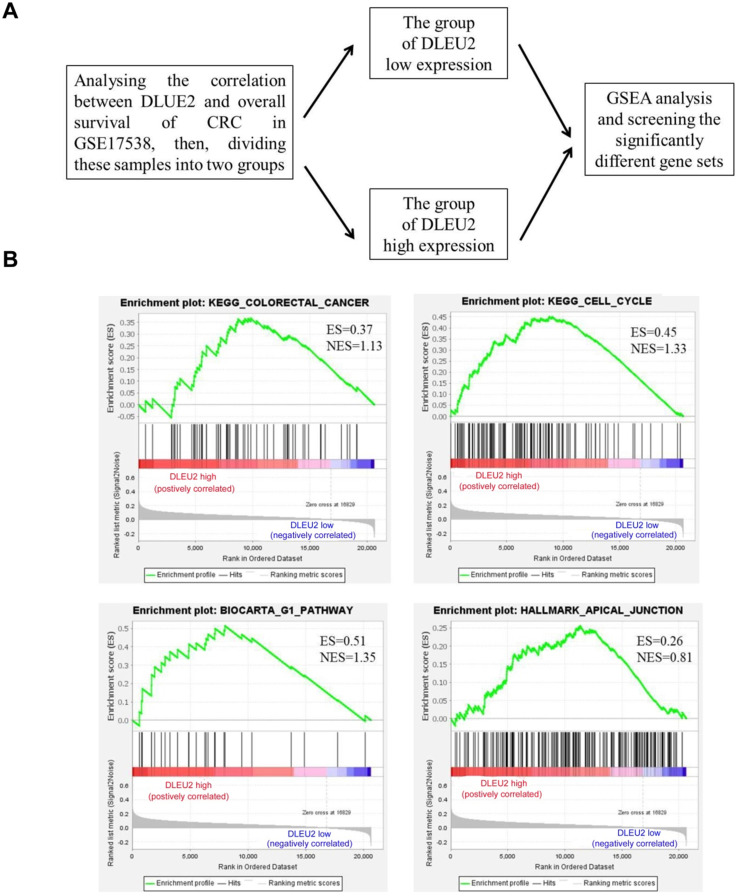
The significantly-different gene sets between CRC specimens with high DLEU2 expression (DLEU2high) and low DLEU2 expression (DLEU2low) were analyzed. (A) Schematic flowchart illustrating the strategy to analyze gene set differences between DLEU2high and DLEU2low cells in CRC specimens from the GSE17538 database revealed by gene set enrichment analysis (GSEA). (B) GSEA identified gene set differences between DLEU2high and DLEU2low. ES: enrichment score; NES: normalized enrichment score.

