Figure 1.
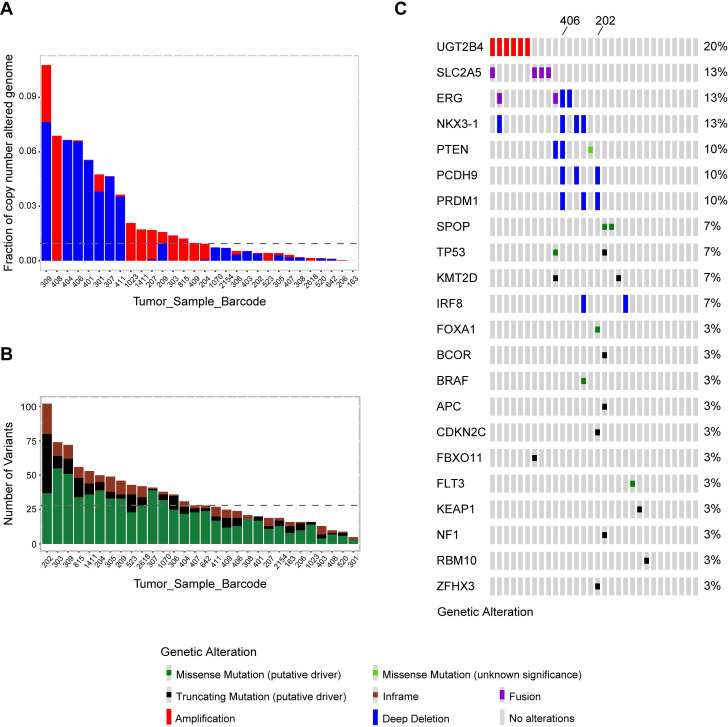
Genomic landscape of Sardinian prostate cancer. A) Fraction of genomic copy number alterations in 30 Sardinian local prostate cancers determined by whole exome sequencing of paired tumor and tumor-adjacent tissue. Amplifications are highlighted by red; deep deletions are highlighted by blue. The highest fraction of altered genome was observed in patient 309, at 0.107. Patient 163 had the lowest fraction of altered genome at 0.00001. The median was 0.009. B) Number of somatic nonsynonymous mutations in 30 Sardinian local prostate cancer samples determined by whole exome sequencing of paired tumor and tumor-adjacent tissues. Truncating mutations are highlighted in black; missense mutations are highlighted in green; the in-frame indels are highlighted in brown. Patient 202 had the highest number of somatic non-synonymous mutations, 103. Patient 301 had the lowest number of non-synonymous mutations, 7. The median is 28 non-synonymous mutations per patient. C) Oncoplot of comprehensive molecular profiling of 30 Sardinian local prostate cancer samples were obtained by whole exome sequencing of paired tumor and tumor-adjacent tissues. Each red bar represents a patient with amplification of the specified gene on the left. Each blue bar represents a patient with deep deletion of the specified gene. Each green dot represents a patient with a putative missense mutation; black dot represents a patient with putative truncating mutation; purple dot represents a patient with fusion of the specified gene. UGT2B4 was amplified in 20% of the tumors and the novel BTBD7-SLC2A5 fusion was observed in 13% of the tumors. Recurrent alterations of putative drivers in prostate cancer, such as ERG, NKX3-1 PTEN, SPOP, FOXA1, were also observed in Sardinian patients with local prostate cancer. Patient 202 had the largest number of somatic putative mutations and patient 406 had the largest number of tumor suppression genes deleted.

