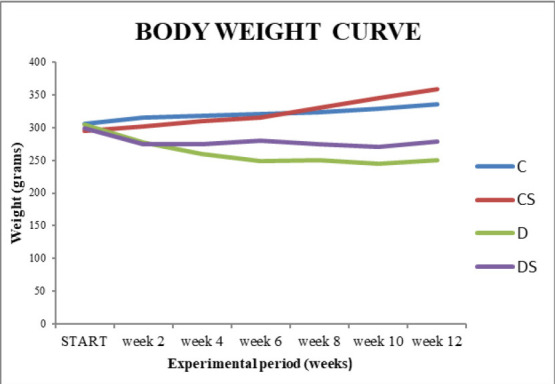
Fig. 1.

Body weight curve during the experimental time of 12 weeks.
C (Control), CS (Control, treated with Saffron), D (Diabetic), DS (Diabetic treated with Saffron)

Body weight curve during the experimental time of 12 weeks.
C (Control), CS (Control, treated with Saffron), D (Diabetic), DS (Diabetic treated with Saffron)