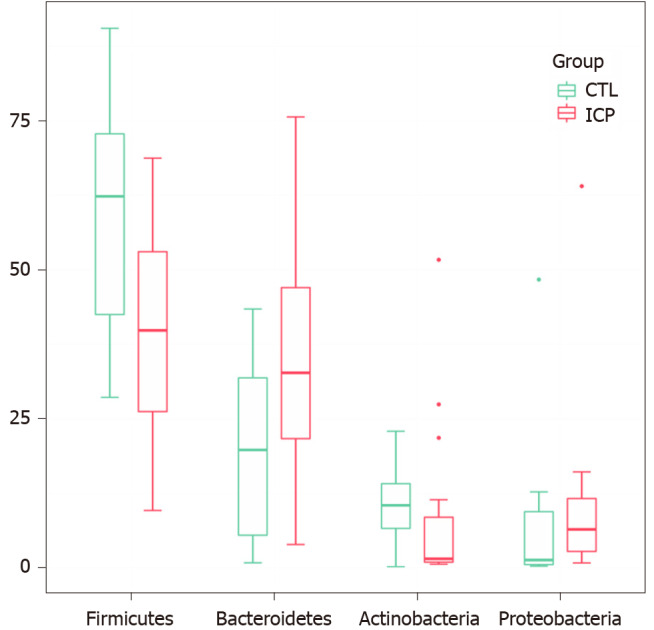
Figure 3.

Changes of gut microbiota at the phylum level between intrahepatic cholestasis in pregnancy and healthy groups. Box plots show the relative abundance of the main phylum in microbiota. The center line denotes the median. Points outside the whiskers represent outlier samples. CTL: Control; ICP: Intrahepatic cholestasis in pregnancy.
