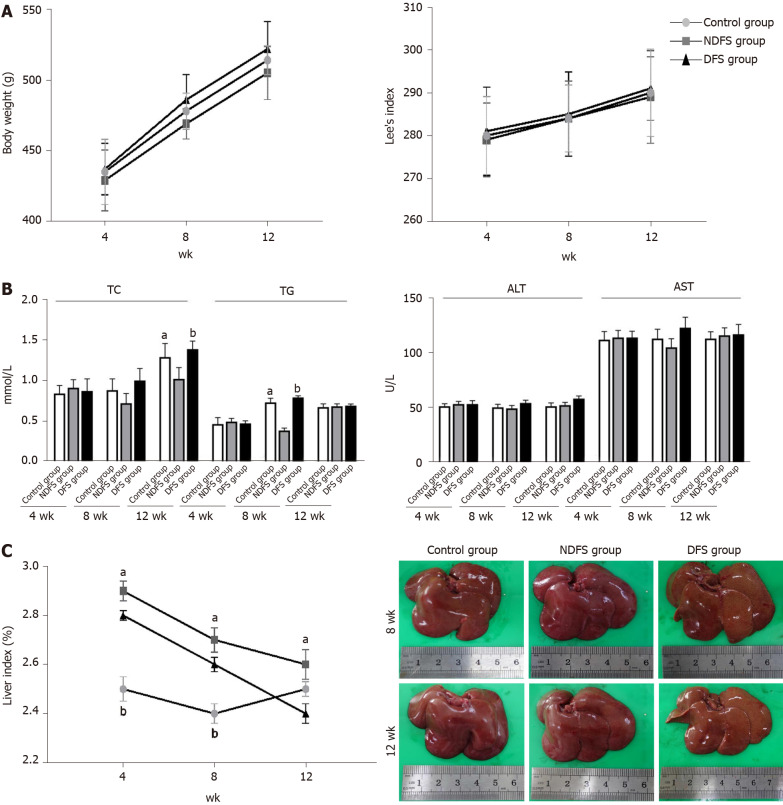
Figure 2.
Metabolic parameters of rats in the three groups. A: Body weight and Lee’s index; B: Serum lipid, serum enzyme levels [bP < 0.05, dry-fried soybeans (DFS) group compared to nonfried soybeans (NDFS) group; aP < 0.05, control group compared to NDFS group]; C: Liver index and liver morphology of rats in the three groups (data are expressed as the mean ± standard deviation; liver index, at week 4 and week 8, bP < 0.05, DFS group compared to control group, aP < 0.05, NDFS group vs control group, at week 12, aP < 0.05, NDFS group compared to DFS group).

