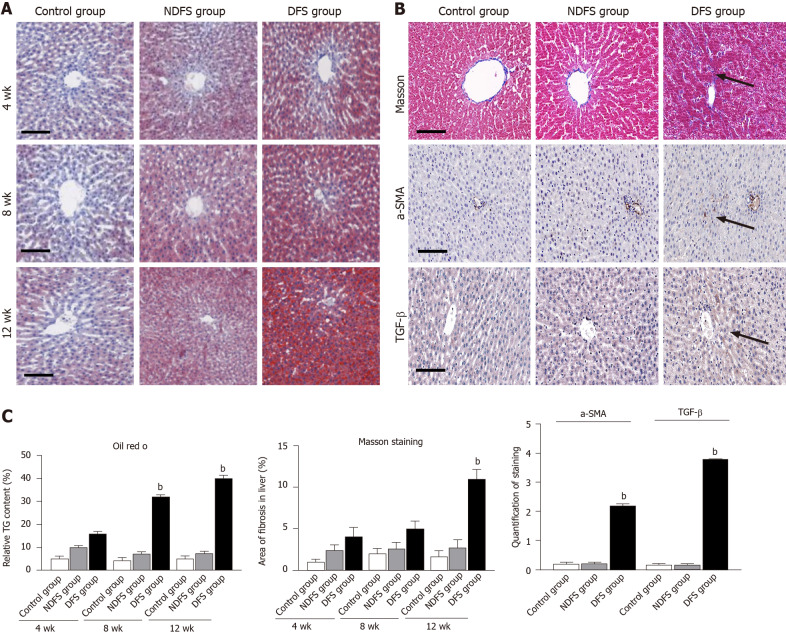
Figure 4.
Oil red O, Masson staining and immunohistochemical staining of rat liver in the three groups. A: Oil red O staining of rats in the three groups at weeks 4, 8 and 12. Scale bars = 50 μm; B: Masson staining and immunohistochemical staining of rats in the three groups at week 12. Scale bars = 50 μm; C: Quantification for the percentage of relative triglyceride content determined by oil red O staining, semi-quantitative analysis of fibrosis detected by Masson staining and immunohistochemical staining. Data are shown as mean ± standard deviation (bP < 0.05, dry-fried soybeans [DFS] group vs control group, nonfried soybeans group [NDFS]).

