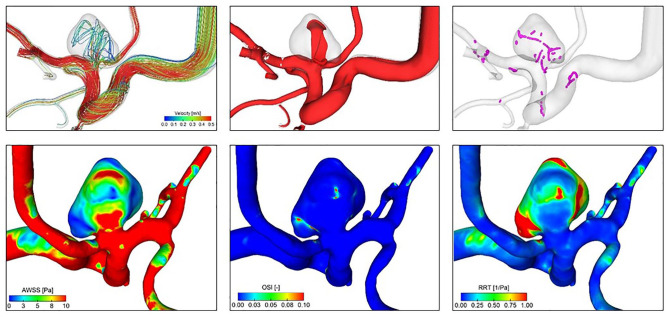
Figure 2.
Exemplary illustration of relevant hemodynamic parameters. Upper row (flow visualization) from left to right: cycle-averaged streamlines color-coding the velocity magnitude; mean isosurface velocity highlighting occurring flow structures; vortex core lines revealing complex flow and the presence of interacting vortices. Lower row (hemodynamic surface forces) from left to right: cycle-averaged wall shear stress (AWSS); oscillatory shear index (OSI); relative residence time (RRT).

