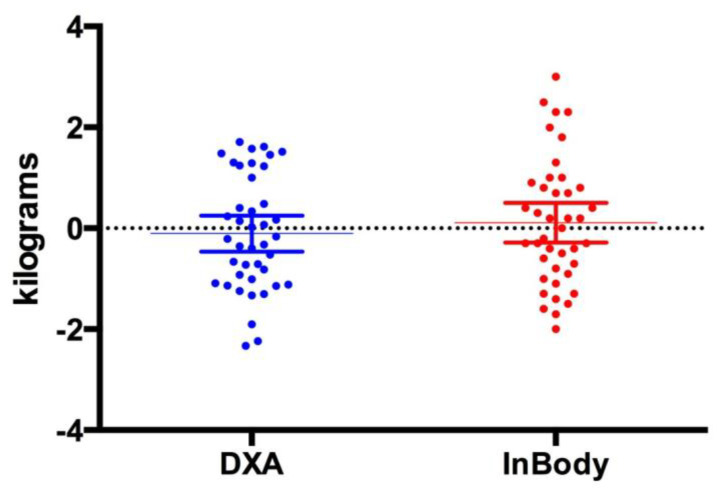
Figure 3.
Change in Fat-free mass. This figure shows individual data points comparing the DXA vs. InBody BIA. The data is presented as the mean (middle horizontal line) with a 95% confidence interval (CI). DXA: Lower 95% CI of mean −0.4627, Upper 95% CI of mean 0.2505, InBody: Lower CI of mean –0.2841, Upper CI of mean 0.5037.

