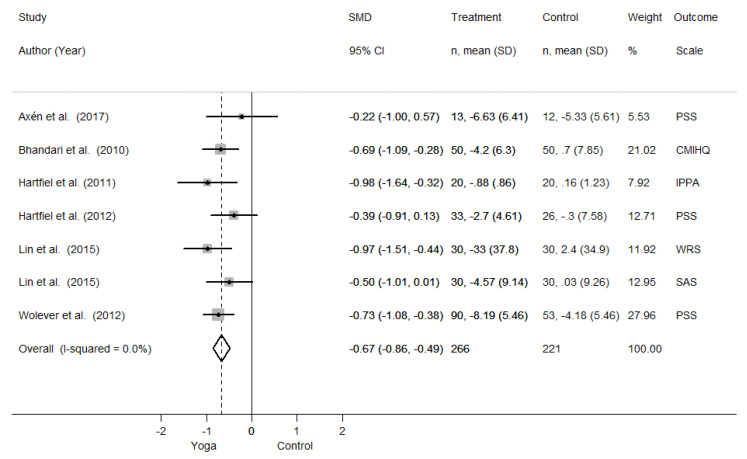
Figure 4.
Forest plot reporting quantitative analysis. SMD = Standardized Mean Difference. CI = Confidence Interval. SD = Standard Deviation. PSS = Perceives Stress Scale. CMIHQ = Cornel Medical Index Health Questionnaire, IPPA = Inventory of Positive Psychological Attitudes, WRS = Work-Related Stress Scale, SAS = Stress Adaption Scale.

