
Figure 3.
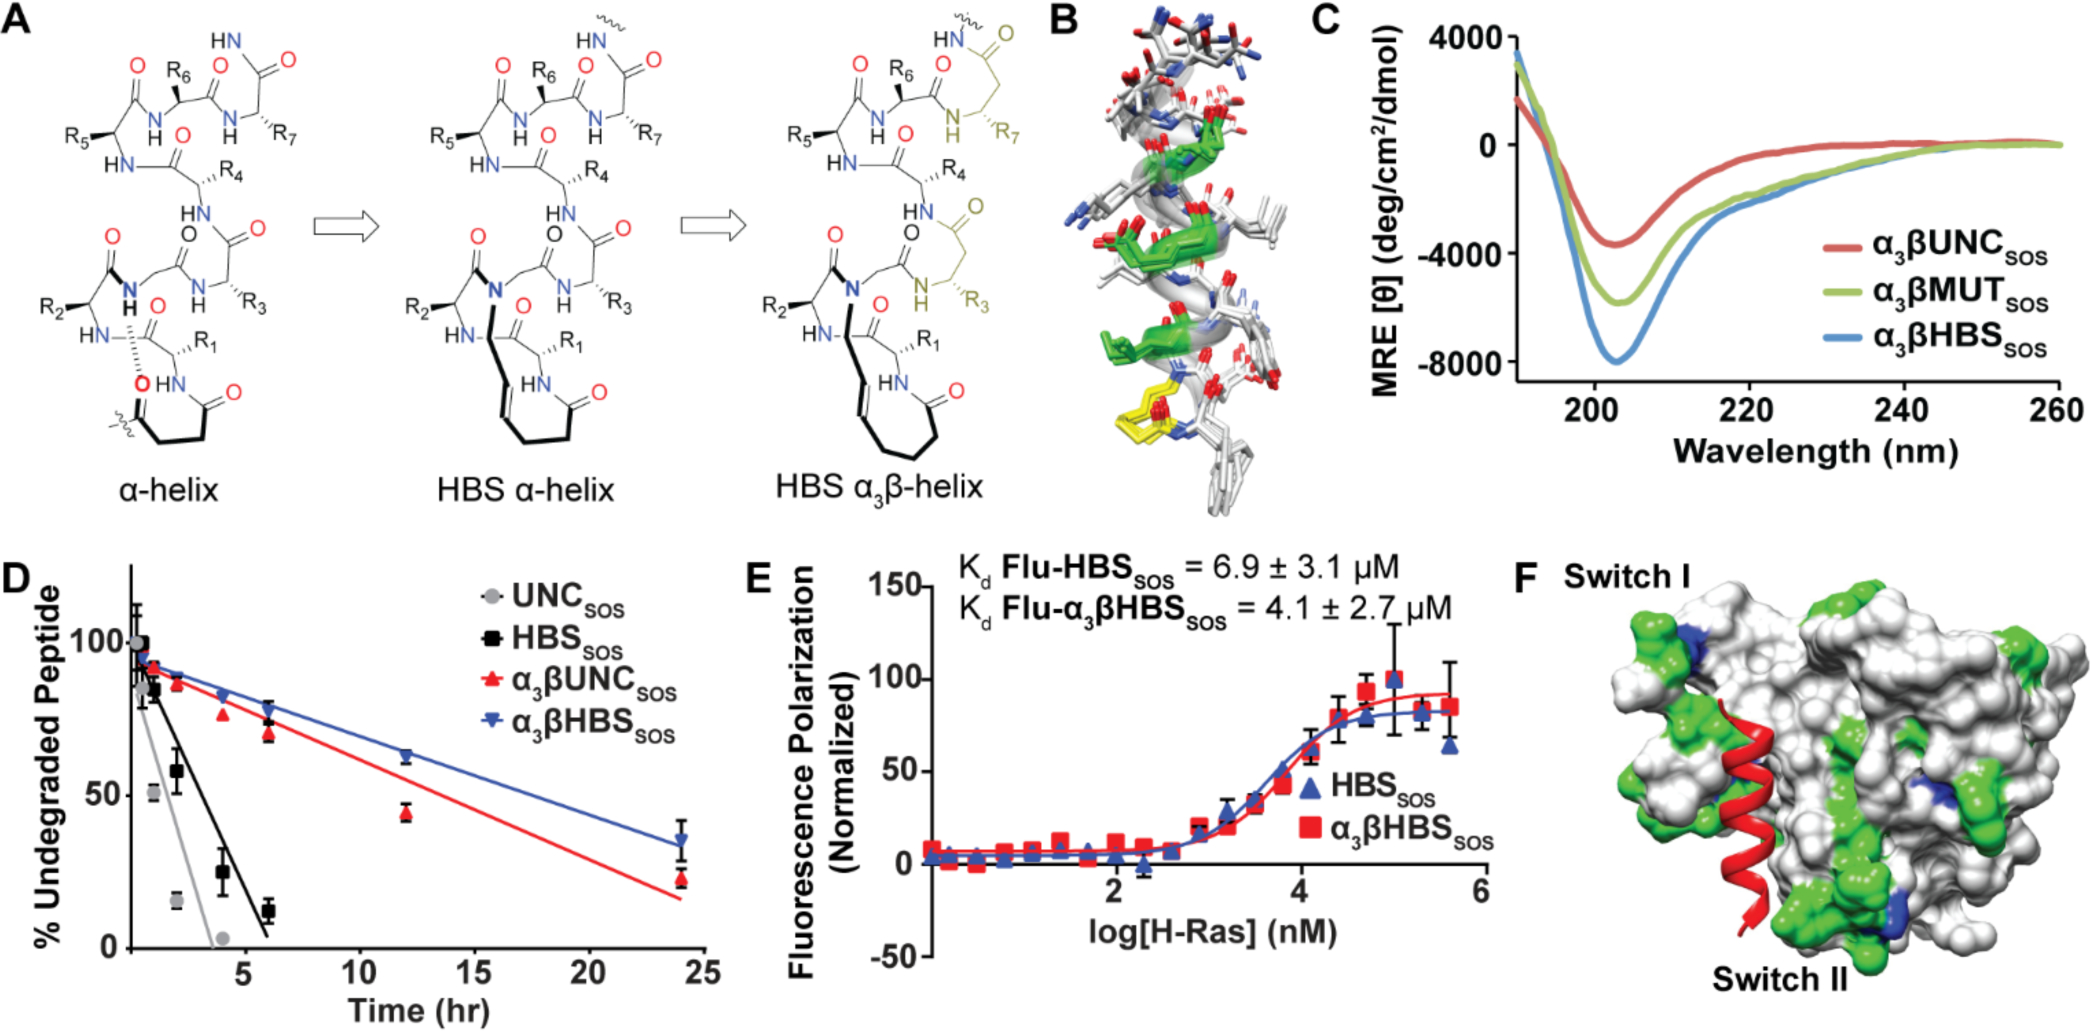
(A) Incorporation of β3-residues within each turn of the HBS helix. (B) Ensemble of the 10 lowest energy structures derived from 2D NMR spectroscopy of α3βHBSSOS (yellow) with β3-residues in green. (C) CD spectra of α3βHBSSOS, α3βMUTSOS, and α3βUNCSOS. (D) Proteolytic degradation of HBS peptides by trypsin over 24 hours. Error bars are mean ± STD of biological triplicates. (E) Fluorescence polarization binding assays of Flu-HBSSOS and Flu-α3βHBSSOS for WT H-Ras. (F) Ribbon view of the 1H-15N-Ras-α3βHBSSOS interaction titrated with increasing amounts of peptide. Residues are colored according to mean chemical shift change: minimal (gray), moderate (green), and significant (blue)