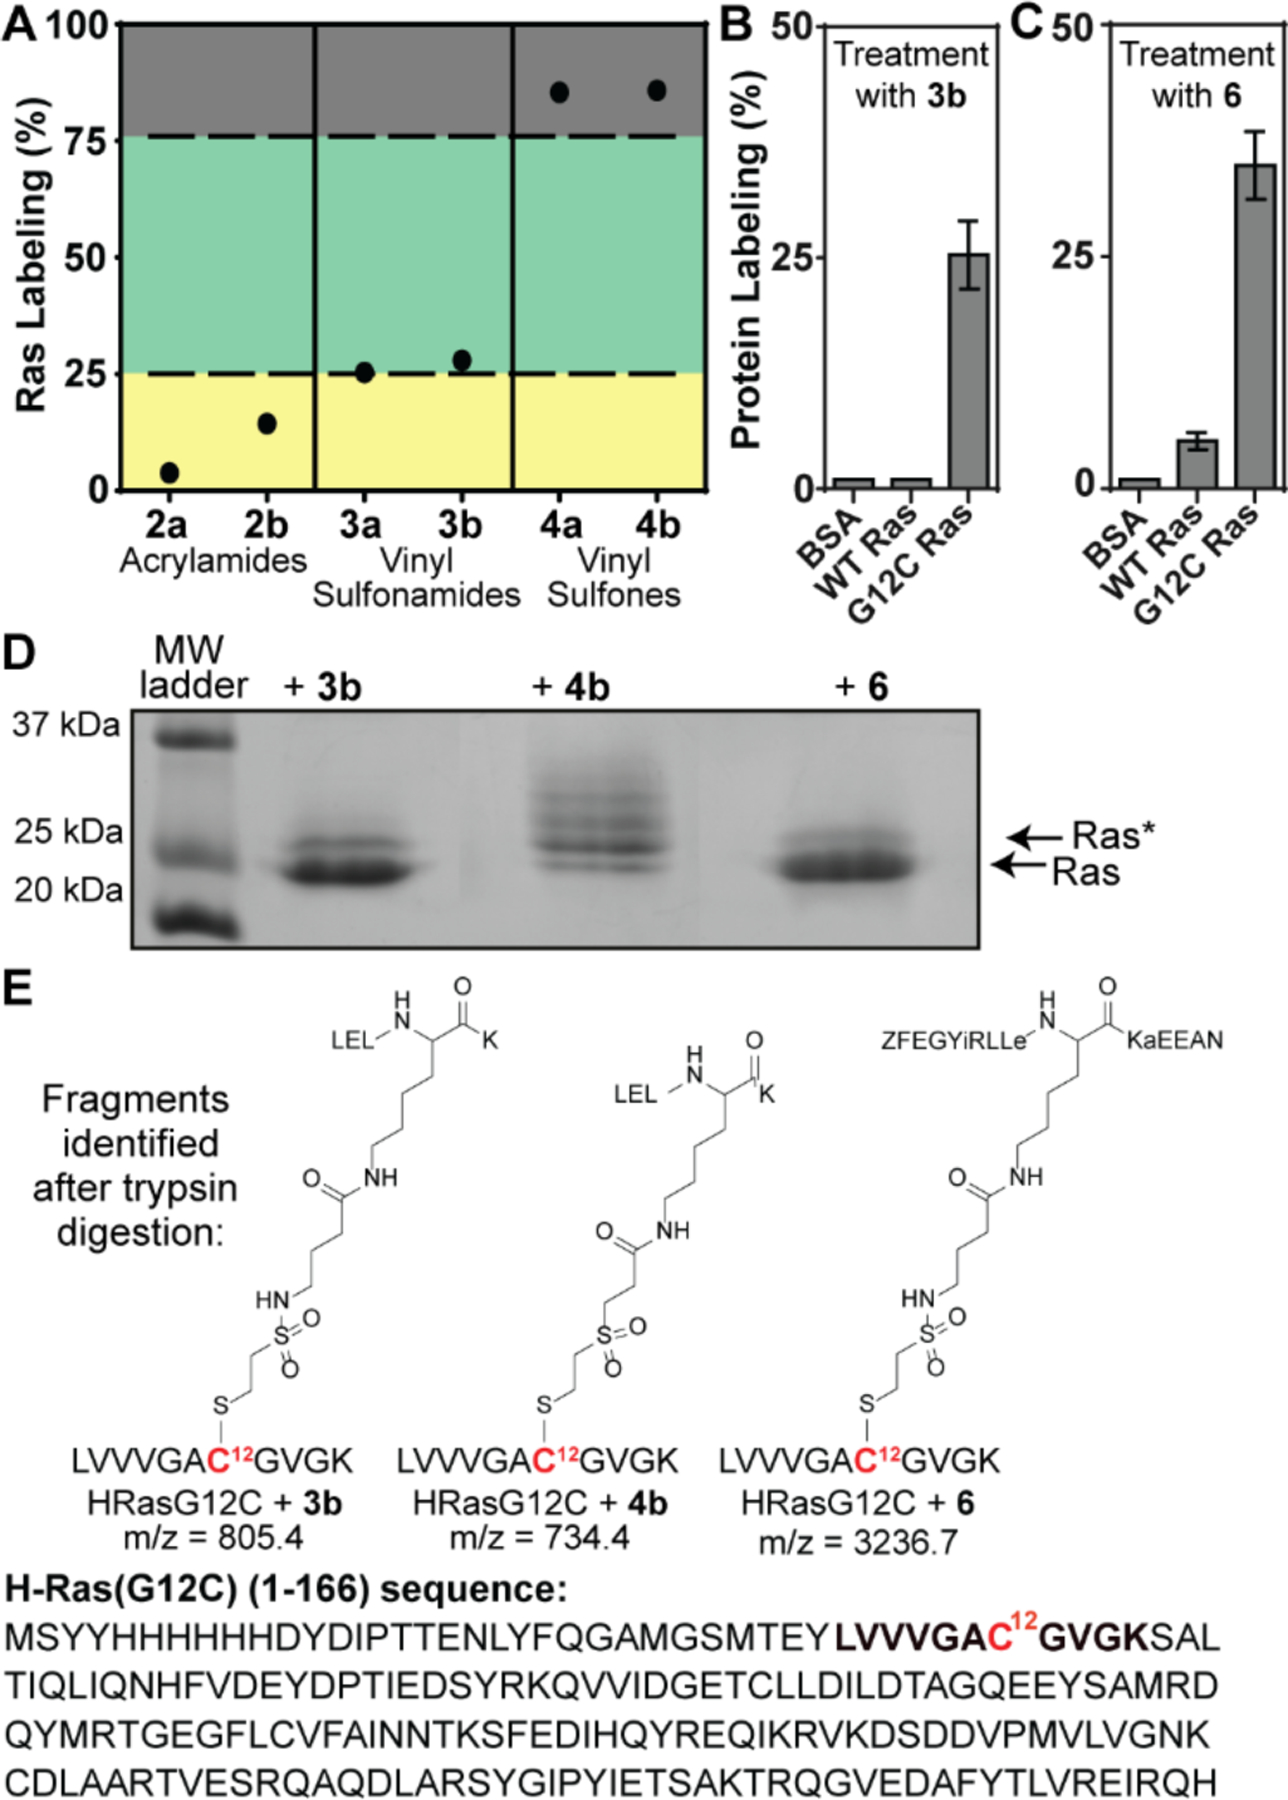
Figure 5.

(A) Scatter plot outlining differences in overall reactivity of the three electrophilic moieties: yellow (low), green (medium), and red (high). (B) Covalent labeling of 3b to BSA, WT H-Ras, and H-Ras G12C. (C) Covalent labeling of 6 to BSA, WT H-Ras, and HRas G12C. (D) Gel shift assay with H-Ras G12C labeled with 3b, 4b or 6. Ras and Ras* refer to the unmodified and monoalkylated protein bands, respectively. (E) Fragment structures identified from MS analysis of trypsin-digested monolabeled Ras gel band. Error bars are mean ± SD of at least two biological replicates.
