
Figure 7.
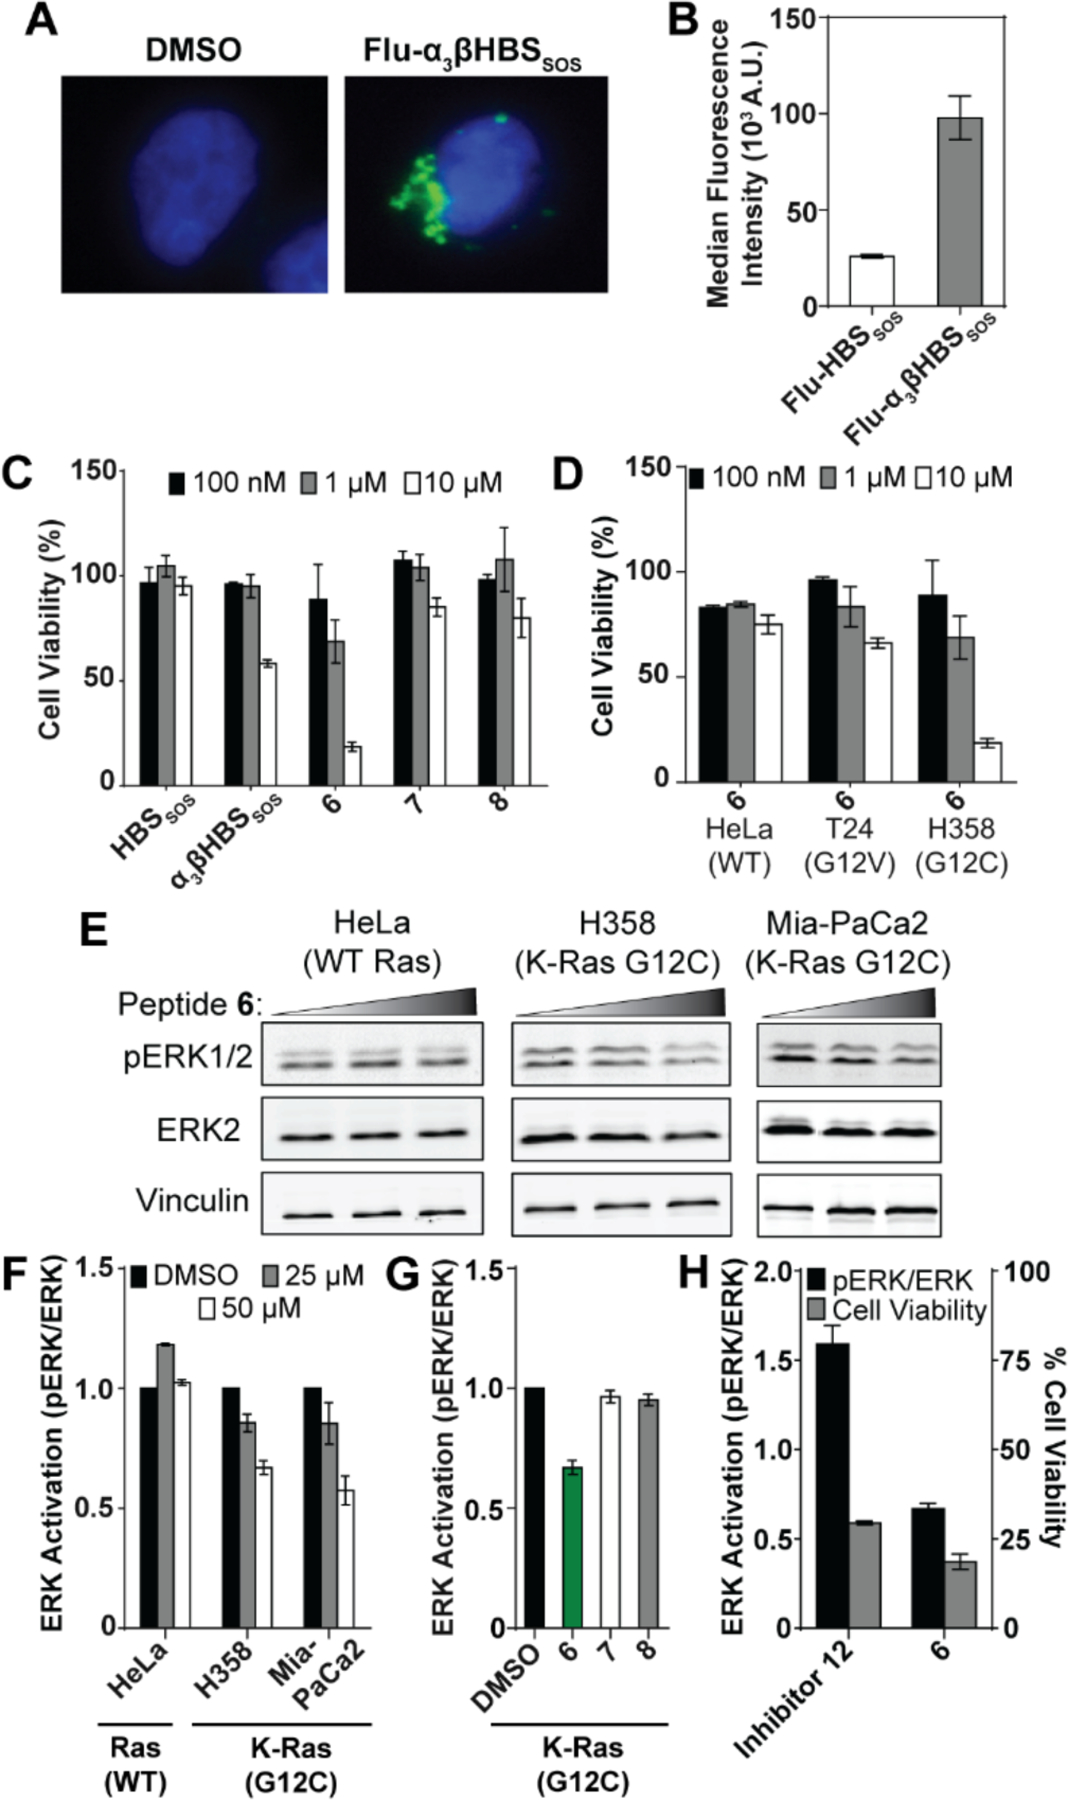
(A) Live cell fluorescence imaging of DAPI-treated H358 cells incubated with Flu-α3βHBSSOS for 4 hours at 40x magnification. (B) Relative median fluorescence intensities in H358 cells after 4-hour incubation with Flu-HBSSOS and Flu-α3βHBSSOS. (C) MTT cell viability in H358 lung cancer cells treated with α3βHBSSOS, α3βHBSSOS, and 4–7 for 72 hours. (D) Comparison of cell viability between HeLa (WT Ras), T24 (H-Ras G12V), and H358 (K-Ras G12C) cells treated with 5. (E-F) ERK activation in HeLa, H358, and Mia-PaCa2 (K-Ras G12C) cells post-treatment with 5. (G) ERK activation in H358 cells post-treatment with our lead compound 5 and control peptides 6–7. (H) Comparison of ERK activation and corresponding cell viability for Inhibitor 12 and 5 in H358 cells. Error bars are mean ± SD of at least two biological replicates.