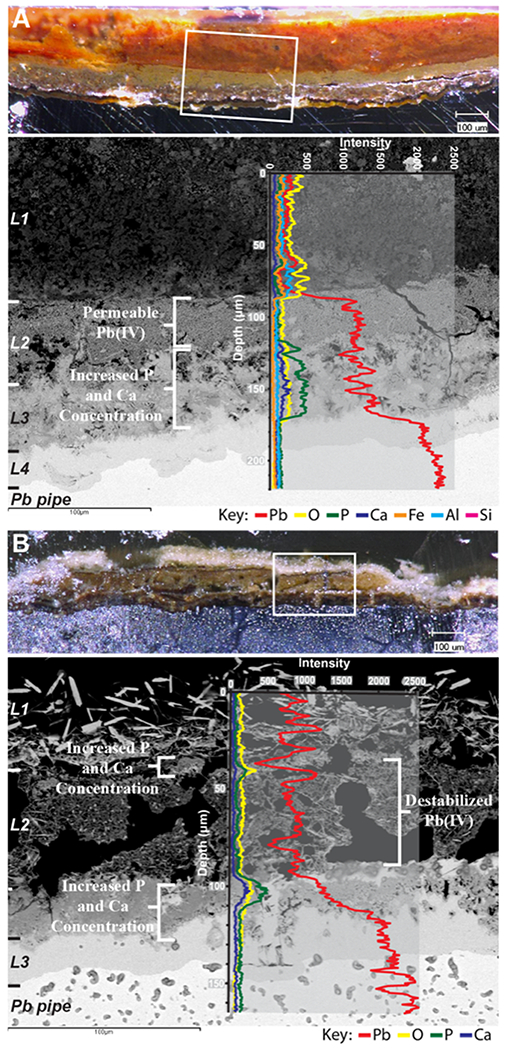
Figure 4.

Light microscopy cross-sectional views coupled with backscatter SEM images overlain with EDS elemental line data for two cross sections from Utility B. White boxes in the light microscopy images show the area of the cross section where the backscatter image was captured, and scale layers are notated along the left-hand side. Light microscopy scale bars = 100 μm; backscatter microscopy scale bars = 100 μm. (A) Pipe B_area1 and (B) pipe B_area2.
