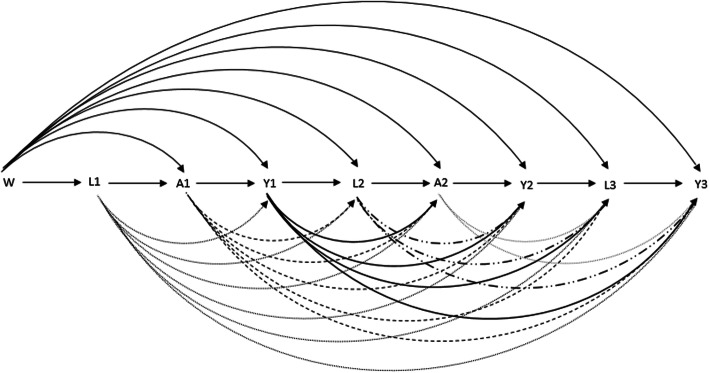
Fig. 2.
Potential causal relationship between the included covariates. Legend: W = Baseline covariates (ses, sex, study centre, parental asthma history); L1, L2, L3 = time varying confounders at ISAAC II, SOLAR I, SOLAR II (hay fever, overweight, smoking, passive smoking, age); A1, A2 = Treatment at ISAAC II and SOLAR I; Y1, Y2, Y3 = intermediate outcomes and final outcome (asthma symptoms) at ISAAC II, SOLAR I, SOLAR II

