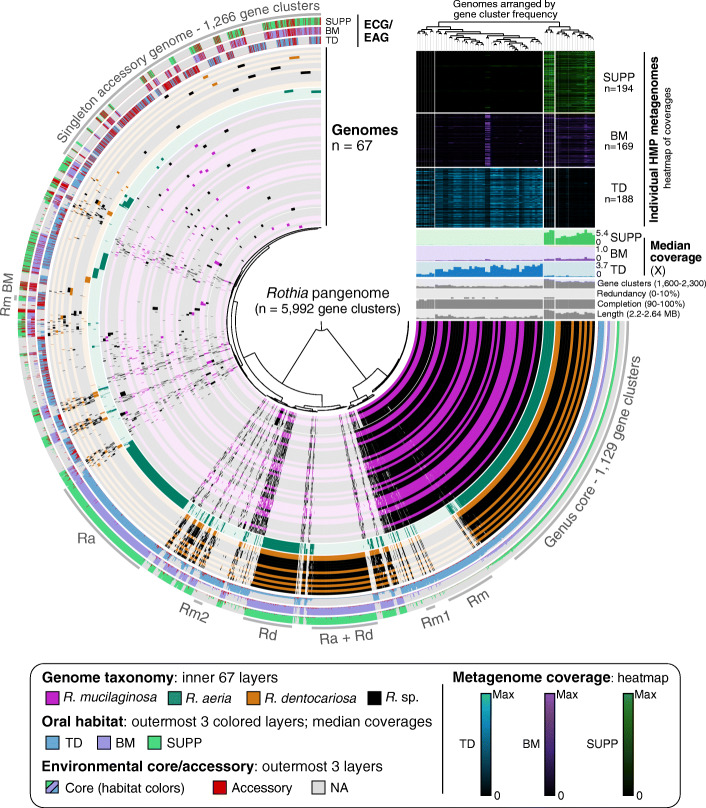
Fig. 3.
Genomes in the Rothia genus metapangenome are organized by gene content into groups that reveal associations to specific habitats. Tips on the inner radial dendrogram, setting the angular axis, correspond to gene clusters organized by presence/absence across genomes. The angular distance thus holds the entirety of the Rothia pangenome, 5992 distinct gene clusters. The inner 67 layers (270° arcs) represent genomes, colored by NCBI’s taxonomic assignments, and are organized by their gene cluster frequencies (top right vertical dendrogram). Each genome’s gene cluster content is displayed by filling in cells (gene clusters) for genomes in which that gene cluster is present. Gaps in radial spacing of layers delineate major groups determined by inspection of the pangenome and dendrogram. Groups of gene clusters are annotated with text and a gray arc—“Genus core” are gene clusters core to the genus Rothia; “Rm,” R. mucilaginosa; “Rm1,” R. mucilaginosa subgroup 1; “Ra + Rd,” both R. aeria and R. dentocariosa; “Rd,” R. dentocariosa; “Rm2,” R. mucilaginosa subgroup 2; “Ra,” R. aeria; “Rm BM,” BM-abundant R. mucilaginosa. The outermost colored three layers show the proportion of genes within each gene cluster deemed environmental accessory (red) or core for HMP metagenomes from tongue dorsum (blue), buccal mucosa (violet), and supragingival plaque (green). If a genome was not well detected (< 0.5 of nucleotides covered by all metagenomes), all its genes were NA (gray) instead of environmentally core or accessory. Above the genome content summaries, each genome’s median coverage across all TD, BM, and SUPP metagenomes is shown in the colored bar graph. Per-sample coverage of each genome is shown in the heatmap above, where each row represents a different sample, and cell color intensity reflects the coverage. Coverage is normalized to the maximum value of that sample (black = 0, bright = maximum; colors as before for each site)

