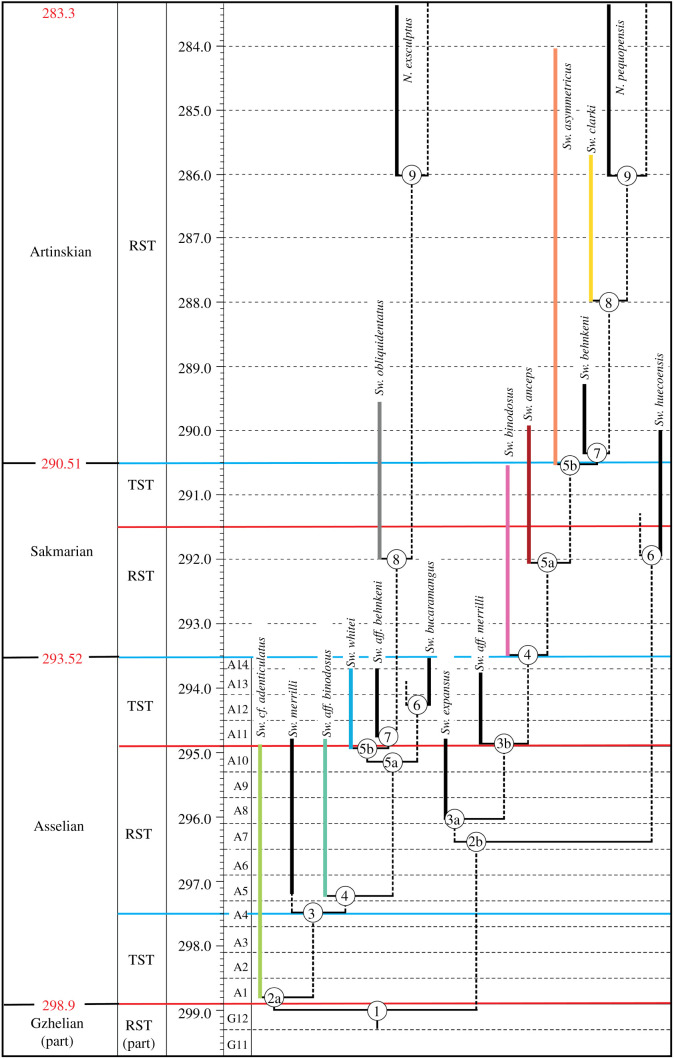
Figure 4.
Sweetognathus phylogenetic hypothesis. The numbered nodes refer to character transitions (electronic supplementary material, Phylogenetic Hypothesis). Sea-level fluctuations are indicated by the blue and red lines which represent transgressive system tracts (TST) and regressive system tracts (RST) [40]. Colours correspond to species in figure 3. Evolutionary lineages examined in this study are early Asselian taxa, Sw. cf. adenticulatus and Sw. aff. binodosus, late Asselian taxa, Sw. whitei and Sw. obliquidentatus, Sakmarian taxa, Sw. binodosus and Sw. anceps and finally Artinskian taxa, Sw. asymmetricus and Sw. clarki. (Online version in colour.)

