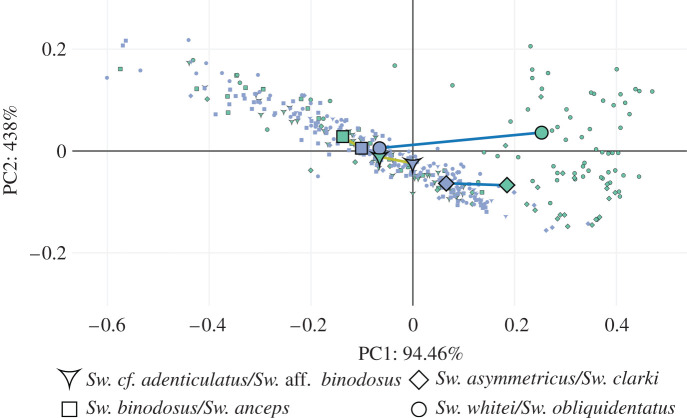
Figure 5.
Phenotypic trajectories between species of Sweetognathus grouped by time of diversification and geographical location (evolutionary lineages). Principal components (PCs) were calculated from the covariation matrix of mean shapes using the RRPP package [44,45]. The blue points represent the initial phenotype expressed by a population in an evolutionary sequence, while the green points (outlined in black) represent the end phenotype expressed. Species were grouped into evolutionary sequences based on their degree of relatedness (figure 4), time and location of diversification, and HC results. Sweetognathus cf. adenticulatus and Sw. aff. binodosus were tested against Sw. binodosus and Sw. anceps as having parallel evolutionary sequences (gold lines). Sweetognathus whitei and Sw. obliquidentatus were tested against Sw. asymmetricus and Sw. clarki as having parallel evolutionary sequences (dark blue lines). (Online version in colour.)

