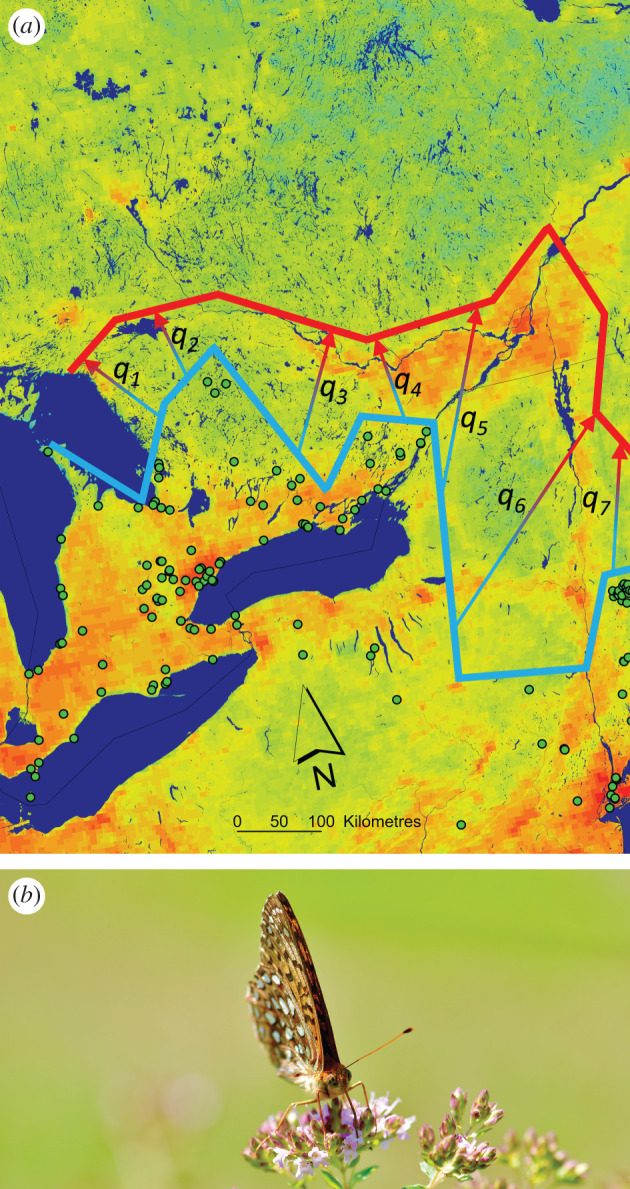
Figure 2.

(a) Species distribution models or other approaches can yield estimates of the displacement of a species’ geographical range over time. The gap between historical northern range margins, shown approximately as the southern line across the mapped area near the observation points (black-outlined dots) for the species, and the expected range boundary (northern line) following climate change can be measured based on the average distance between those boundaries, shown as q1–7. This value can be compared against known dispersal capacities to predict whether the species will persist using the framework developed through equations (3.1)–(3.5). (b) A great spangled fritillary (Speyeria cybele), one of many butterfly species whose poleward range expansion in response to climate change has been modelled in North America. Photo by J. Kerr. (Online version in colour.)
