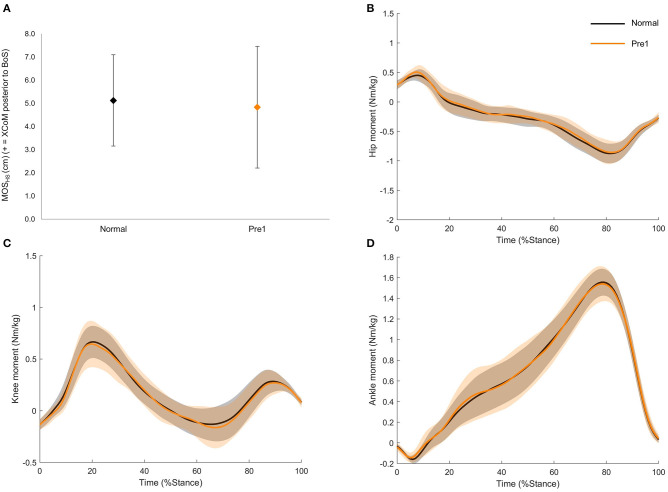
Figure 2.
(A) Group mean and standard deviation of the margin of stability at heel strike (MOSHS) for Normal and Pre1. (B) Group mean and standard deviation (shaded region) hip moment for Normal and Pre1. (C) Group mean and standard deviation (shaded region) knee moment for Normal and Pre1. (D) Group mean and standard deviation (shaded region) ankle moment for Normal and Pre1. Positive moments are extensors, and negative are flexors. Black diamond and lines represent Normal; orange diamond and lines represent Pre1. No significant differences were detected for any parameter.

