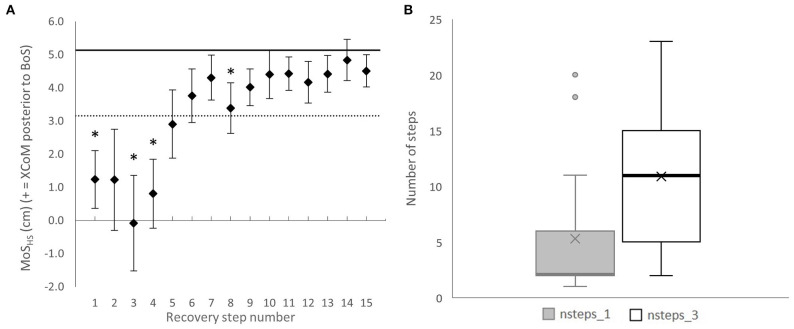
Figure 4.
(A) Group mean margin of stability at heel strike (MoSHS) from the first to 15th recovery step with standard error. The solid horizontal black line represents the averaged MoSHS during Normal gait; the dotted horizontal black line represents one standard deviation from Normal. *Significantly different from Normal, p < 0.0033. (B) Box plot representing the number of steps required to have one step back within normal range (nsteps_1, grey box) and the number of steps required to have at least three consecutive steps back within normal range (nsteps_3, white box). The lower (Q1) and upper quartiles (Q3) represent observations outside the 25–75th percentile range. The diagram shows the mean (crosses) and median (thick horizontal lines) for nsteps_1 and nsteps_3, respectively (for nsteps_1: median = Q1; therefore, the line of nsteps_1 overlays the one of Q1). Data falling outside Q1 and Q3 are outliers.

