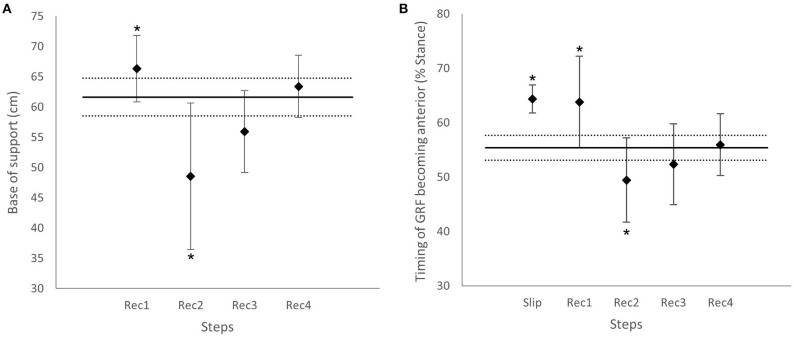
Figure 5.
(A) Group mean base of support at heel strike (BoS) from the first to fourth recovery steps with standard deviation. The solid horizontal black line represents the averaged BoS during Normal gait; the dotted horizontal black lines represent one standard deviation from Normal. *Significantly different from Normal, p < 0.01. (B) Group mean timing of ground reaction force (GRF) angle becoming anterior from Slip to Rec4, with standard deviation. The solid horizontal black line represents the averaged GRF angle becoming anterior during Normal gait; the dotted horizontal black lines represent one standard deviation from Normal. *Significantly different from Normal, p < 0.01.

