
Fig. 2 |. UMAP projections of compiled COVID-19 FCM dataset.
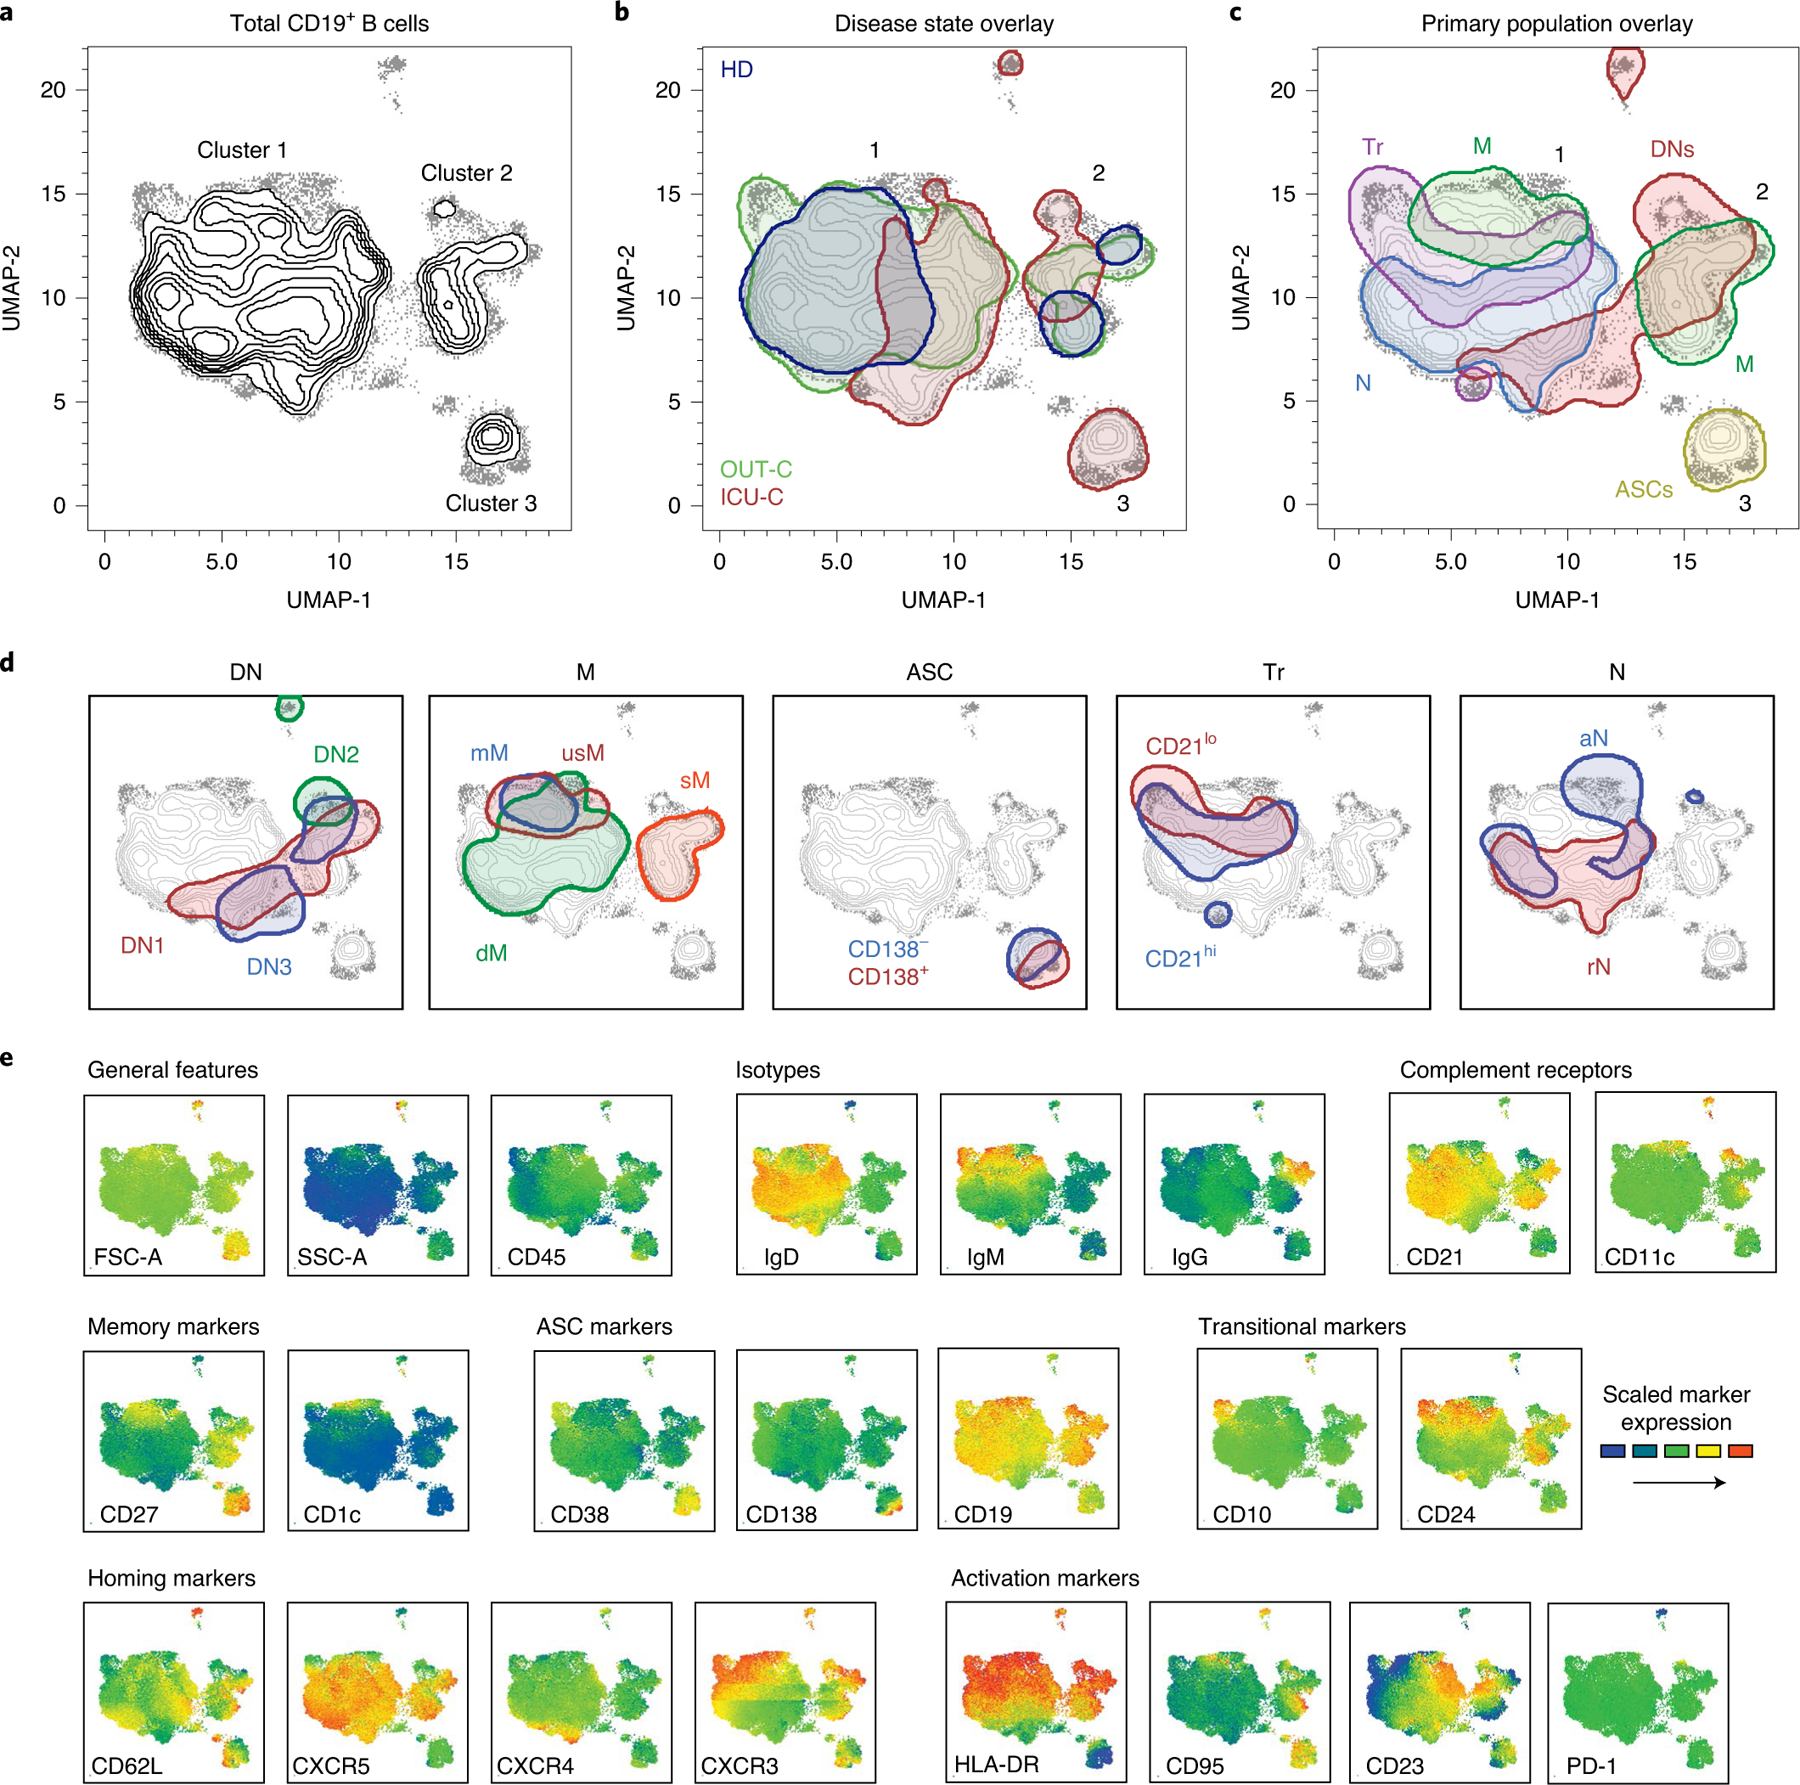
a, UMAP projection of composite patient samples. Composite sample was derived from 1,000 representative cells from patients analyzed with spectral panel V2 (Methods; HD: n = 12; OUT-C: n = 7; ICU-C: n = 10). b–d, Outlined regions represent the 90% equal probability contouring from the indicated classification. b, Patient disease status overlaid on the composite UMAP projection from a. c, Primary populations as gated in Fig. 1a and Table 1 overlaid on the composite UMAP projection from a. d, Secondary populations as gated in Fig. 1b–f and Table 1 overlaid on the composite UMAP projection from a. e, Heat maps of select marker expression overlaid on composite UMAP projection from a. b–d, Outlined regions contain 90% of cells derived from the indicated classification.