
Extended Data Fig. 3 |. COVID-19 infection comparisons with African American HD cohorts.
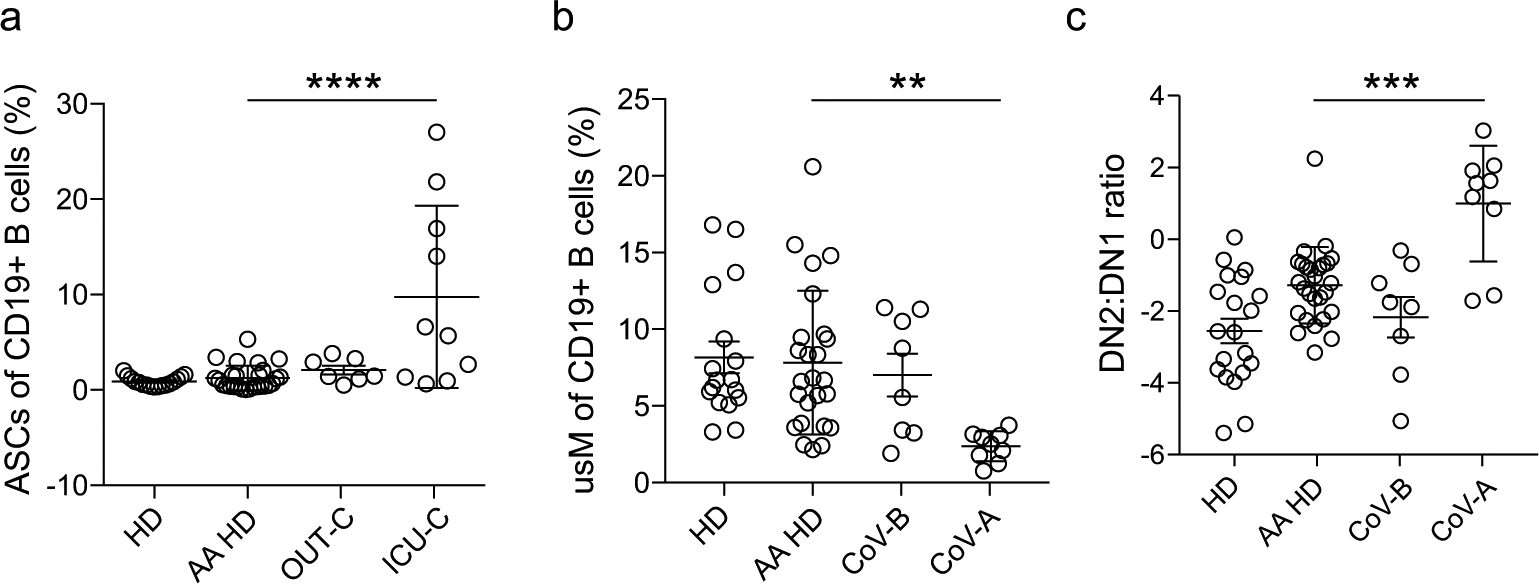
Critical indicators of EF response activation were compared between the current HD cohort (recruited for this study), historically collected HD cohorts of AA descent (AA-HD), and patients groups as in [Figs. 2 and 3]. a, ASC frequency of total CD19+ B cells in HD, AA HD, OUT-C, and ICU-C cohorts. b, usM frequency of total CD19+ B cells in HD, AA HD, CoV-B, and CoV-A cohorts. (a) DN2:DN1 ratios in HD, AA HD, CoV-B, and CoV-A cohorts.