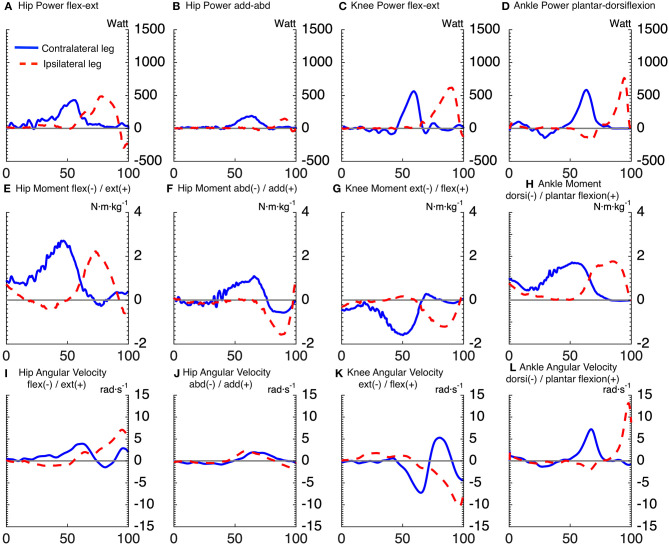
Figure 3.
Time series averaged over subjects, for joints powers (A–D), joints moments (E–H), and joints angular velocities (I–L), of goalkeepers diving to save low balls. Solid lines correspond to the contralateral leg, and the dashed lines to the ipsilateral leg. The x-axis of all subplots is the normalized time expressed in [%]. The titles (A–D) of joints powers indicate the plane of movement of the joint and not the direction of joint rotation. The sign of joints powers reflects power generation (+) and absorption (–).

