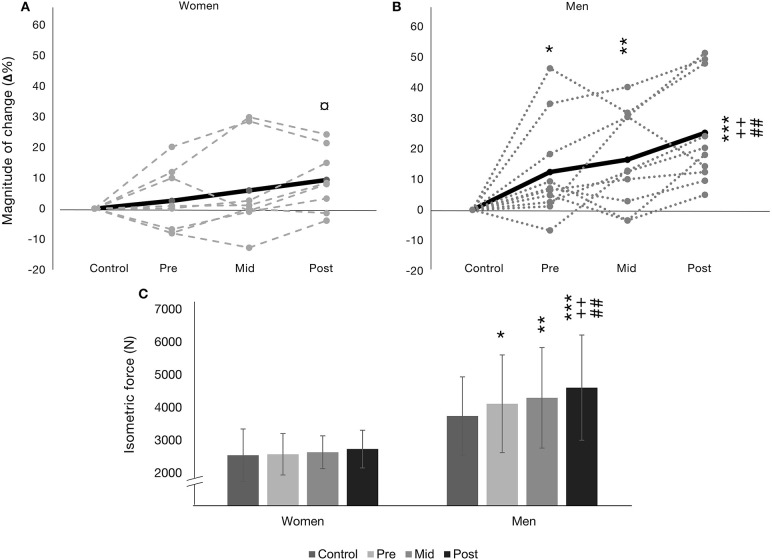
Figure 1.
Isometric bilateral leg press (ISOMmax) presented as relative magnitude of change (Δ%) in (A) for women (n = 8) and (B) for men (n = 10) as mean (black line) and individual changes (gray textured lines). (C) presents absolute means ± SD. *p < 0.05 from control, **p < 0.01 from control, ***p < 0.001 from control, ++p < 0.01 from pre, ##p < 0.01 from mid, and ¤p < 0.05 difference between women and men.

