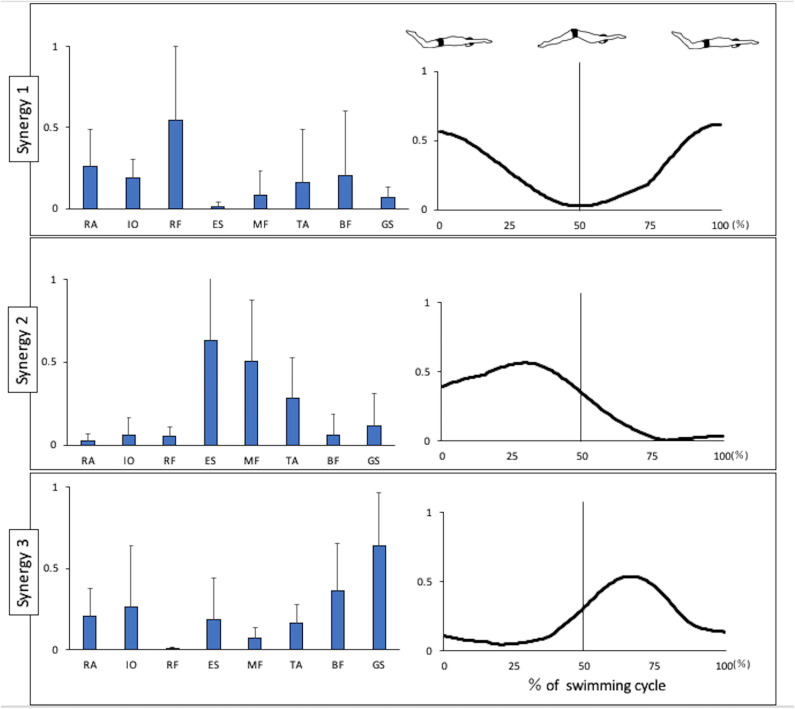
Figure 2.
Synergies extracted during UUS. Muscle synergy vectors are shown at the left side of the figure aligned to the corresponding activation coefficient. The synergy activation coefficients are shown in the right side of the figure by synergy. BF, biceps femoris; ES, erector spinae; GS, gastrocnemius; IO, internal oblique; MF, multifidus; RA, rectus abdominis; RF, rectus femoris; TA, tibialis anterior.

