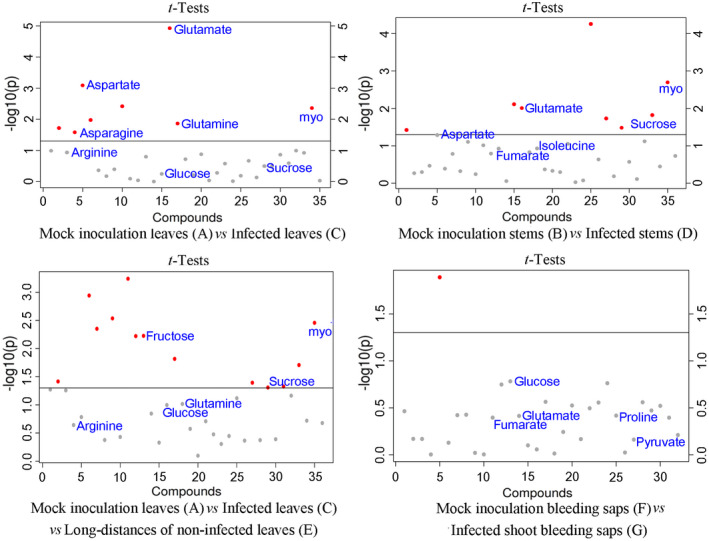
FIGURE 2.

ANOVA score plots of metabolomic changes in A. chinensis var. chinensis “Hongyang” by nuclear magnetic resonance. All the metabolites (VIP > 1.0) were represented by points. The gray points indicate p > .05 and the red points indicate p < .05 using t test (n = 6)
