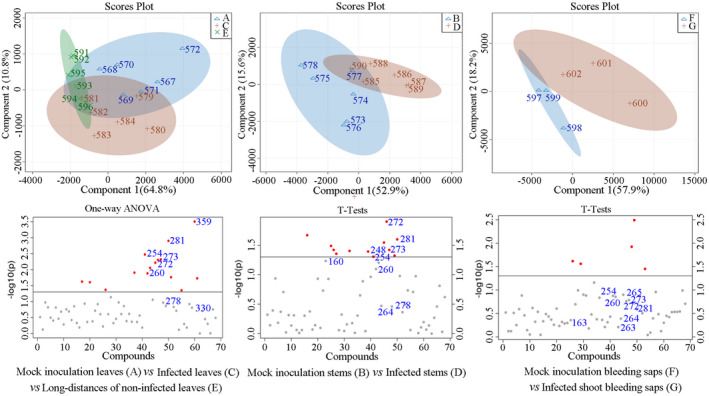
FIGURE 3.

Partial least square‐discriminant analysis score plots and ANOVA of metabolomic changes in A. chinensis var. chinensis “Hongyang” by gas chromatography‐mass spectrometer. The metabolites represented by each number are given in the Name List of Table S2. All the metabolites (VIP > 1.0) were represented by points. The gray points indicate p > .05 and the red points indicate p < .05 using t test (n = 6)
