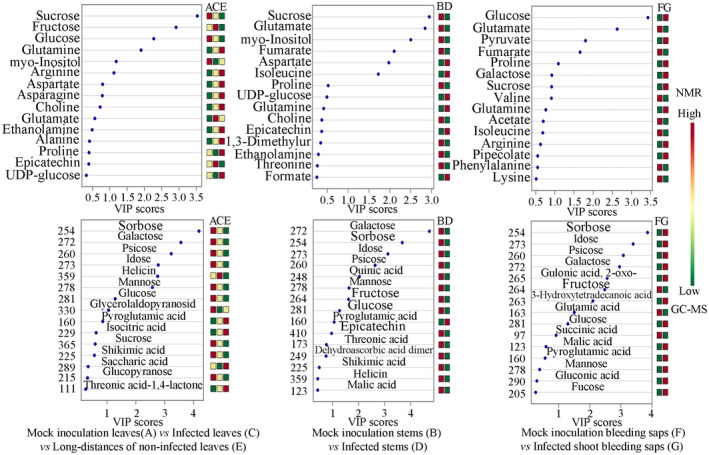
FIGURE 4.

VIP (variable importance in projection) score plots of metabolomic changes in A. chinensis var. chinensis “Hongyang” by nuclear magnetic resonance (NMR) and gas chromatography‐mass spectrometer (GC‐MS; n = 6). The color box on the right reflects the concentrations of this metabolite in different groups. Red, yellow, and green indicate the concentration range from high to low, respectively
