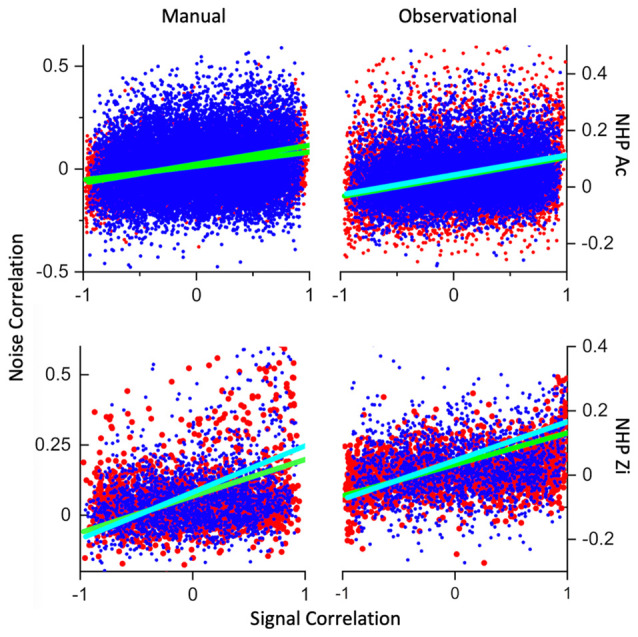
Figure 7.

Signal- vs. noise-correlation. Plotted in red are the R trial datapoints from all datasets for each NHP and task, while blue datapoints are from the NR trials. Cyan line is a linear fit to the NR trials and green are linear fits to the R data. The x-axis is signal-correlation while the y-axis is the noise-correlation. All datasets had highly significant linear fits between most of the variables involved, including trial-type, y-intercept and slope of the linear fits. All datasets for NHP-Zi, and the manual datasets for NHP-Ac also showed highly significant fits for signal-correlation *trial-type vs. noise-correlation. Statistics included below from the ANOVA output for the relationships between signal-correlation, noise-correlation and trial-type. MATLAB aoctool was utilized for this analysis of covariance (ANCOVA). Number of data sets was (N = 3 for all but NHP-Ac Manual N = 4, see “Materials and Methods” section for trial and unit #s). NHP-Ac manual task, group (R vs. NR), p = 0, F(1,61,743) = 63, group * X (signal correlation) p = 0, F(1,61,743) = 100. NHP-Ac OT, group, p = 0, F(1,49,682) = 35. NHP-Zi manual task group p = 0.0004, F(17,524) = 13, group * X p = 0.001, F(17,524) = 11. NHP-Zi OT group p = 0, F(19,016) = 17, group * X F(19,016) = 23, p = 0.
