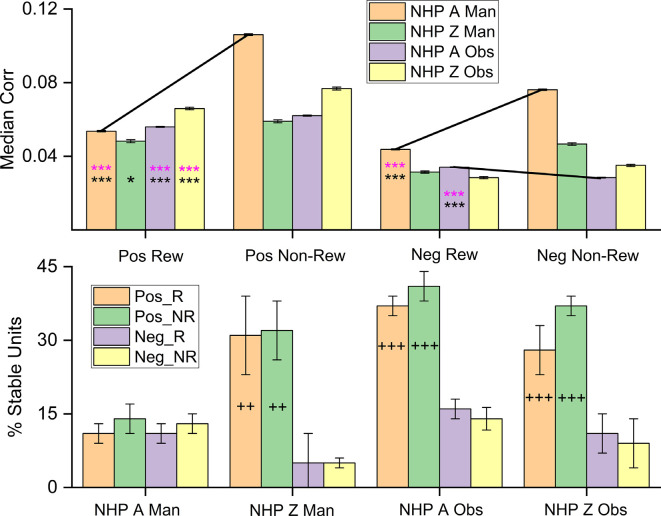
Figure 8.
Median noise-correlation during the post-cue period for positive (Pos) and the absolute value of the negative (Neg) noise-correlation coefficients during R (Rew) and NR (Non-Rew) trials from all data (Top Row, ± SEM, for the median, over all data points from all dataset). Significance was determined using KS-test and Wilcoxon signed-rank) *,***, where p < 0.05, p < 0.001 respectively). All comparisons between Pos data sets for R and NR trials were significant, where significance was determined by Wilcoxon rank-sum (p < 0.05) and KS-tests (p < 0.05), as were differences between Pos and the absolute value of the Neg trials (all p < 0.001). The standard error of the medians was on the order of 0.0004–0.0008 for the median plots. (Bottom Row) The percentage of units that remain within a single category (Pos_R, Pos_NR, Neg_R, Neg_NR) throughout the task from post-cue, during pre-results and post-result periods (± SEM over dataset percentages). The Percent stable units were significantly different after post hoc testing between the groups with + on their bar. The number of + signs indicates how many out of the three datasets showed post hoc differences between the Pos and Neg subsets for both R and NR trial types (p < 0.05 post hoc, MATLAB multicomparewith Tukey’s honest significant difference criterion). Note separate keys for top and bottom rows.

