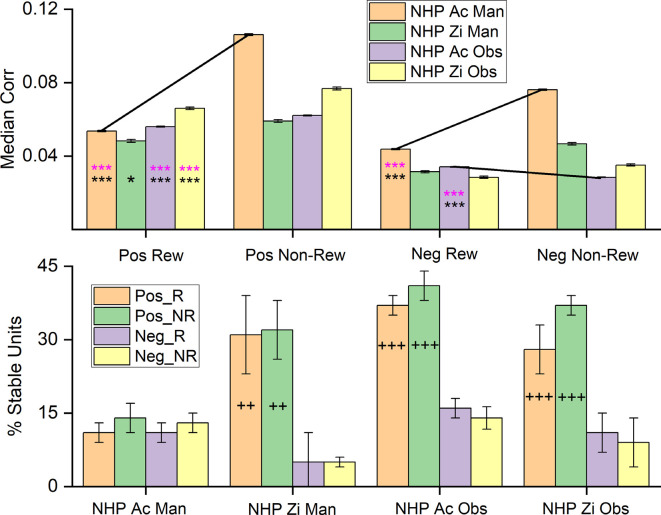
Figure 9.
The median correlation coefficient for the High Positive, High Negative, and Low-responsive subpopulations each NHP-Ac and task as labeled. Black and pink asterisks located on the graph indicate there is a significant difference between the subpopulations during R and NR trials for Wilcoxon rank-sum and KStest2 respectively (p < 0.05, and p < 0.001 denoted by * and *** respectively).

