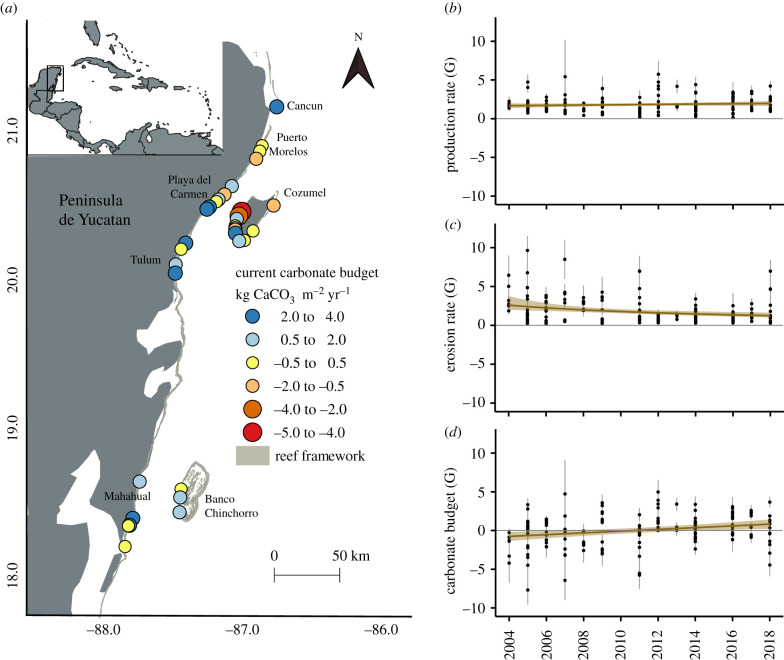
Figure 1.
Temporal carbonate budget dynamics in the Mexican Caribbean. (a) Current (2017–2018) net carbonate budgets of the 34 surveyed reefs; (b) model prediction of gross production from 2004 to 2018; (c) model prediction of erosion rate from 2004 to 2018; and (d) model prediction of net carbonate production from 2004 to 2018. In (b–d), mean site values are represented as black points; standard error for each mean estimated values are presented as vertical grey lines. Model effects are shown as lines (with 95% confidence intervals). Units in kg CaCO3 m−2 yr−1(G). (Online version in colour.)

