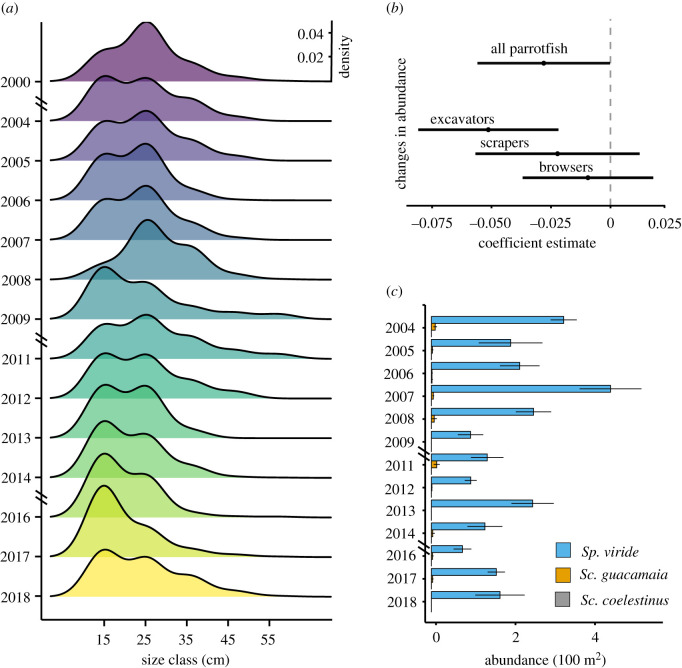
Figure 3.
Temporal changes in parrotfish size and abundance. (a) Kernel density estimates for parrotfish size class (cm) distribution by year. Second y-axis in (a) shows the estimated density value, which is uniform for all curves as it gives the probability distribution from the dataset so that the total area under each curve is equal to one. (b) Coefficient estimates and confidence intervals of the fitted generalized linear models for parrotfish abundance: lines represent each model coefficient and the 95% confidence interval for the overall parrotfishes, for excavating species, for scraping species and for browsing species. (c) Species-specific abundance (ind. 100 m−2) of the excavating parrotfishes over time. (Online version in colour.)

