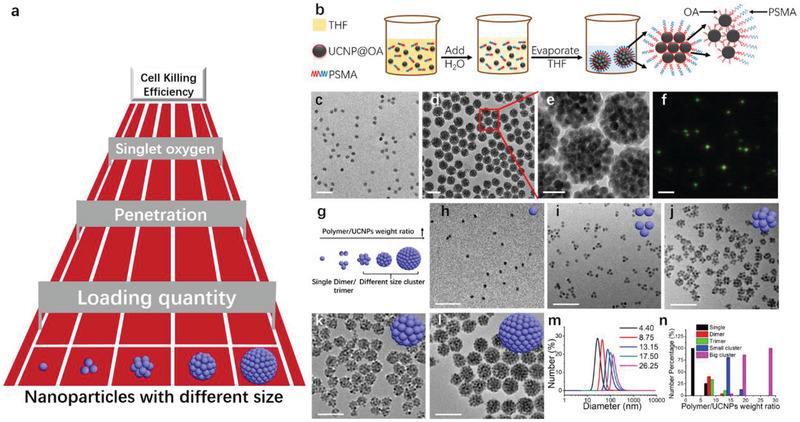
Figure 1.

Polymer induced UCNPs self‐assembly. a) A schematic of factors influencing the tumor cell killing efficacy when using UCNPs of different sizes. b) Schematic of PSMA induced self‐assembly of single UCNPs into UCNPs clusters. c) TEM image of UCNPs (NaYF4: 20% Yb, 2% Er, the diameter is about 22 nm, green fluorescence). d) TEM image and e) magnified TEM image of UCNPs sphere clusters. f) Luminescence microscopy image of spherical UCNPs clusters under 980 nm excitation. Scale bar, 200 nm for (c,d); 50 nm for (e) and 2 µm for (f). g) Schematic representation of controllable UCNPs clusters morphology with different polymer/UCNPs weight ratios. Representative TEM micrographs of UCNPs morphology in water after THF evaporation with different polymer/UCNPs weight ratios: h) 4.40; i) 8.75; j) 13.15, k) 17.50; l) 26.25. Scale bar, 200 nm. m) DLS results of typical UCNPs morphology in water after THF evaporation with different polymer/UCNPs weight ratio. n) Statistical analysis of fractions of different particles for different polymer/UCNPs weight ratios. At least 100 objects were analyzed for each sample.
