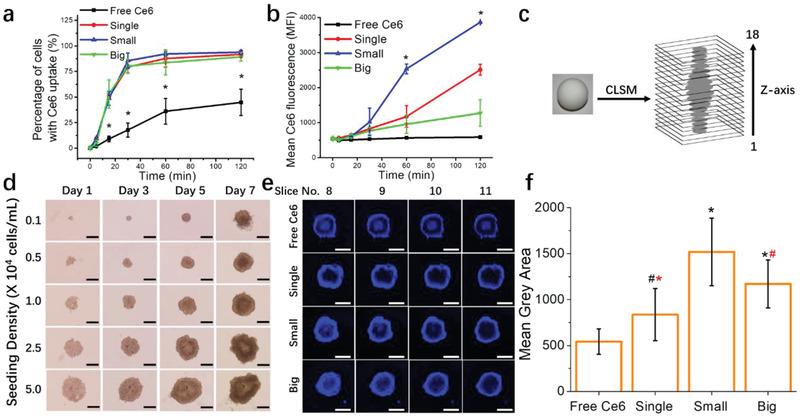
Figure 3.

The role of UCNPs clusters sizes in intracellular uptake and penetration in 3D organoids. MB49 monolayer cells were treated with free Ce6 or clusters containing 2.5 × 10⁻⁶ m of Ce6 for 2 h, and Ce6 fluorescence in cells was detected via flow cytometry. a) Flow data analysis is represented as the percentage of cells with Ce6 fluorescence (* denotes significance compared to single, small and big groups), and b) mean Ce6 fluorescence intensity over time (* denotes significance compared to free Ce6, single and big groups). 3D MB49 spheroids were treated with free Ce6 or clusters containing 40 × 10−6 m of Ce6 for 2 h before confocal microscopy. c) Schematic of z‐stack image acquisition of spheroids. The entire depths of spheroids were captured in 18 layers of z‐planes images with 23.9 µm intervals between each plane. d) Characterization of MB49 spheroids. Phase‐contrast images of MB49 spheroid growth for seven days in culture with different seeding concentration (cells mL−1, 0.2 mL plated each well). Images were obtained at 4x objective. Scale bar, 500 µm. e) Slice 8 to 11 are included in the figure as they are representative of the spheroid equator. f) Ce6 fluorescence signals (mean grey area) within the equator sections (slice 8–11) of each spheroid were calculated using Image J software (black *, # denotes significance compared to free Ce6 and red *, # denotes significance compared to small group). Imaging was performed on a Zeiss LSM710 laser scanning microscope using a 5x objective lens. Scale bar, 500 µm. Data represented as mean ± SD. Experiments were performed twice in duplicates (n = 4). # p < 0.05, *p < 0.005. One‐way ANOVA with a Bonferroni post‐hoc analysis was used for comparison among multiple groups.
