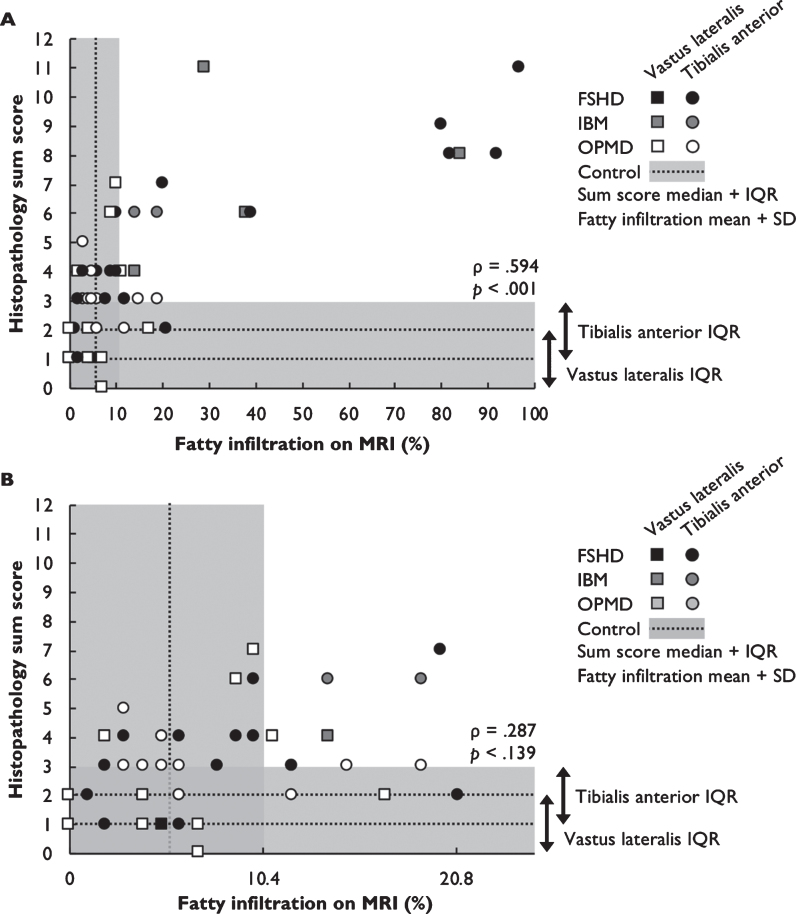
Fig. 3.
Correlation between fatty infiltration and histopathology sum score. 3A Histopathology sum score correlates moderately with fatty infiltration on MRI in TIRMNEG muscle biopsies from patients with IBM, FSHD and OPMD. Gray shading marks fatty infiltration ≤10.6% (control mean±SD) and histopathology sum scores ≤3 (control median±IQR). 3B Normal amounts of fatty infiltration (≤10.6%) can be associated with histopathology sum scores within the control range, but also with intermediate scores (range 0–7). Normal histopathology sum scores (≤2 for vastus lateralis, ≤3 for tibialis anterior) are encountered in muscles with up to 20.7% fatty infiltration.

