Figure 6.

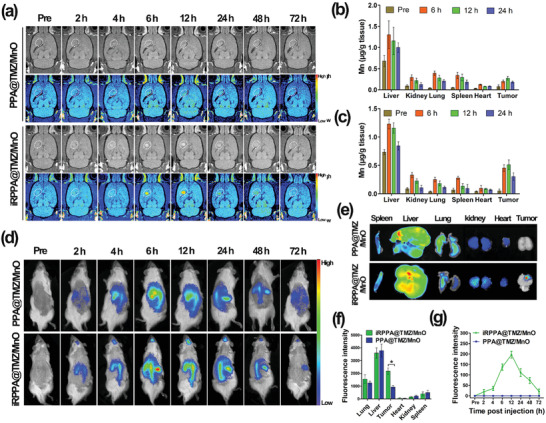
In vivo distribution of nanodrug. a) In vivo serial T1WI MRI images of the intracranial orthotopic glioma before and after intravenous injection of PPA@TMZ/MnO and iRPPA@TMZ/MnO (dose: 5 mg Mn kg−1). Mn accumulation in tumor and major organs before and after intravenous injection of b) iRPPA@TMZ/MnO and c) PPA@TMZ/MnO detected by ICP‐MS (n= 3). d) In vivo fluorescence imaging of C6 tumor‐bearing rats after intravenous injection of PPA@DiR/MnO and iRPPA@DiR/MnO at different time points. e) Ex vivo fluorescence imaging of the major organs and tumor at 72 h after nanodrug injection. f) Relative fluorescence intensities of the ex vivo major organs and tumor at 72 h after nanodrug injection. Data are expressed as mean ± SD (n= 3). *p< 0.05. g) Dynamic changes of fluorescence intensity in tumor against time after injection of PPA@DiR/MnO and iRPPA@DiR/MnO. Data are expressed as mean ± SD (n= 3).
