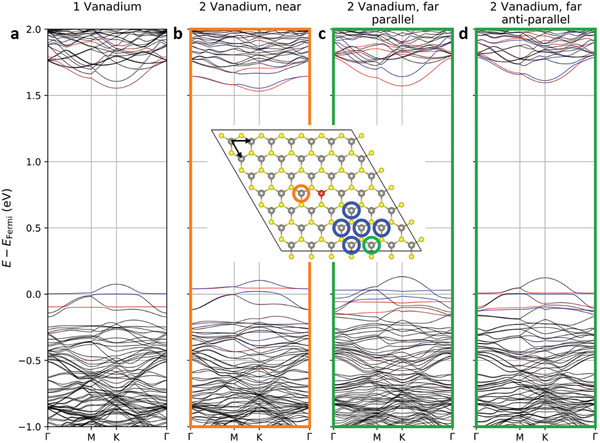
Figure 3.

DFT calculation results for V‐doped WS2 monolayers. All non‐equivalent positions for the second V dopant are circled. The band structures of a) single vanadium and b–d) two vanadium atoms with the nearest and the farthest separations are plotted. Other, symmetry non‐equivalent k‐directions (due to low‐symmetry dopants placements) look similar (Figure S12, Supporting Information). Red/blue indicates spin up/down polarization for states of V character. The arrows in the supercell show the primitive‐cell lattice vectors used to label dopant pairs in Table 1.
