
Figure 1.
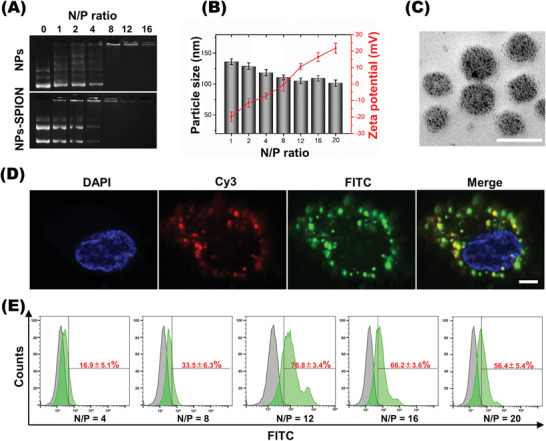
Characterization of cDNA plasmid‐complexed and SPION‐loaded nanoplex. A) Electrophoretic mobility of cDNA plasmid in agarose gel after complexing with mPEG‐PEI (NPs) and mPEG‐PEI/SPION (NPs‐SPION) at various N/P ratios. B) Particle size and zeta potential of nanoplexes at various N/P ratios. Data are shown as mean ± SD, n = 3. C) Morphology of nanoplex prepared at N/P 12 as measured by transmission electron microscope (TEM). Scale bar: 200 nm. D) Fluorescence microscopic images revealed pDNA (green) and nanocarrier (red) inside EPCs transfected with pDNA/NPs‐SPION. Scale bar: 2 µm. E) N/P ratio‐dependent transfection efficiency quantified using flow cytometry assay (n = 5).