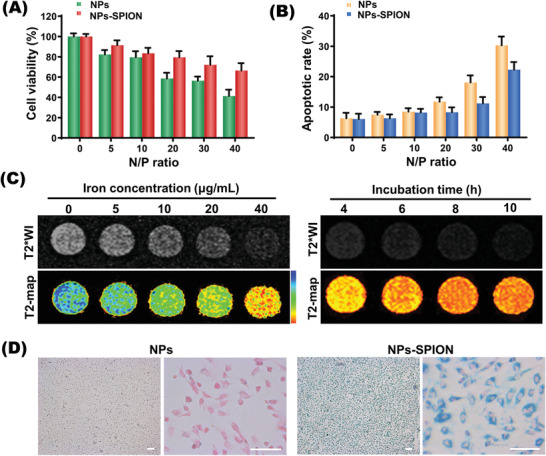
Figure 2.

Cytotoxicity and cellular uptake. A,B) Cell viabilities and apoptosis rates detected by CCK8 and by flow cytometry at various N/P ratios in EPCs transfected with NPs and NPs‐SPION. Data are shown as mean ± SD, n = 3. C) T2‐weighted imaging (T2WI) and pseudocolored imaging of EPCs after incubation with NPs‐SPION at various Fe concentrations and time. D) Prussian staining (blue) microscopic images showed abundant iron particles inside EPCs transfected with NPs‐SPION in contrast to EPCs transfected with SPION‐free (NPs) control. Scale bar: 100 µm.
