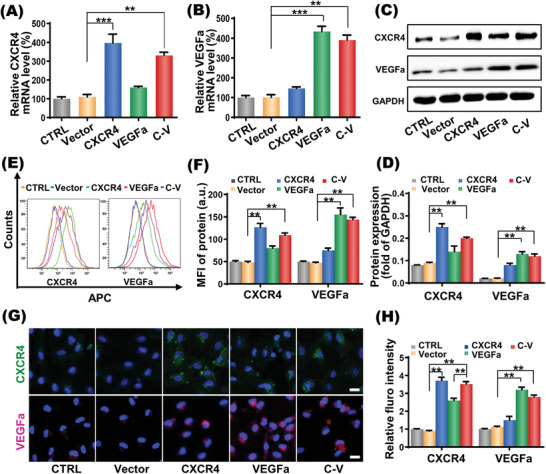
Figure 3.

In vitro gene expression regulation of EPCs. A,B) CXCR4 and VEGFa mRNA expression in EPCs transfected with Vector/NPs‐SPION(Vector), CXCR4/NPs‐SPION(CXCR4), VEGFa/NPs‐SPION(VEGFa), CXCR4‐VEGFa/NPs‐SPION(C‐V) and cells without treatment (CTRL). C) Representative photographs and D) quantification analyses of CXCR4 and VEGFa protein expressions in transfected EPCs assessed by Western blotting. E) Representative photographs and F) quantification analyses of CXCR4 and VEGFa protein expressions in transfected EPCs assessed by flow cytometry. G) Representative photographs and H) quantification analyses of CXCR4 and VEGFa protein expressions in transfected EPCs evaluated by laser confocal scanning microscopy (LCSM). Scale bar: 10 µm. Data are shown as mean ± SD, n = 5. **P < 0.01, ***P < 0.001.
