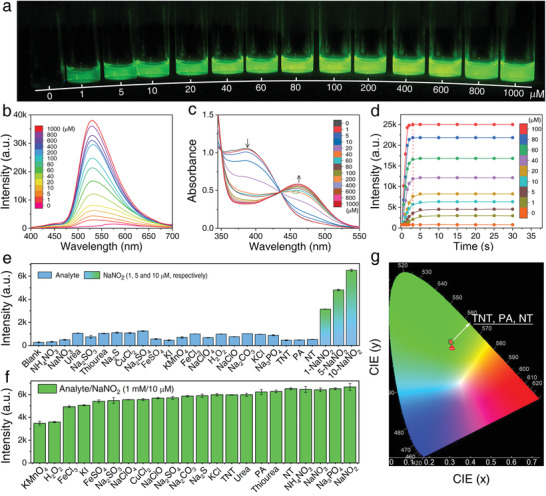
Figure 2.

a) Optical images obtained under irradiation with a 365 nm UV lamp. b) Fluorescence spectra and c) UV–vis absorbance spectra obtained for ortho‐BT in response to different concentrations of nitrite (0–1000 × 10−6 m). d) Time‐dependent fluorescence response of ortho‐BT upon the addition of different amounts of nitrite (0–100 × 10−6 m). (λ ex = 365 nm; λ em= 530 nm; Slits: 2 nm; Integral time: 100 ms; Spectrometer: Maya 2000pro). Fluorescence intensity changes obtained for ortho‐BT in response to e) various analytes (1 × 10⁻³ m), different concentrations of nitrite (1, 5, and 10 × 10−6 m), and f) a mixture of nitrite (10 × 10−6 m) and various analytes (1 × 10⁻³ m). g) CIE spectral consistency of the corresponding fluorescence shown in inset (f); one point represents the colour coordinates in the presence of nitro interferents, while the other one represents the colour coordinates in the presence of the other interferents. (λ ex= 365 nm; Slits: 1 nm; λ em= 530 nm; Slits: 0.3 nm; Integral time: 200 ms; Spectrometer and CIE: Edinburgh FLS1000).
