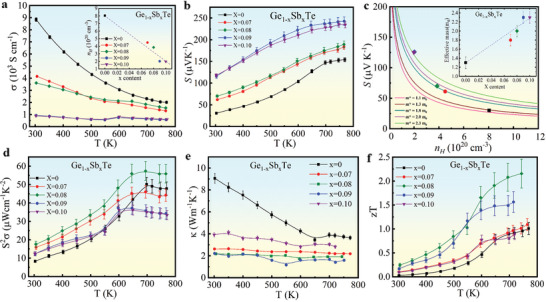
Figure 2.

Thermoelectric properties of GeTe and Sb‐doped GeTe single crystals (GST). Temperature‐dependent a) electrical conductivity, the insert shows the room temperature experimental hole concentration nH as a function of Sb content (x), and b) Seebeck coefficient, c) Pisarenko plots in which the m* values were calculated within the single parabolic band model (smooth traces) by the fit of nH and Seebeck data, the insert shows the m* as a function of x. d) Temperature‐dependent PF, e) total thermal conductivity, and f) figure of merit.
