Figure 3.

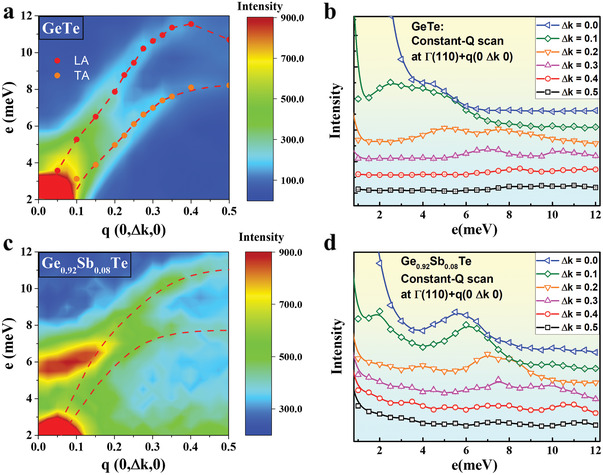
Inelastic neutron scattering studies of GeTe and Sb‐doped GeTe. Phonon dispersions relation from S (Q, E) with function of energy transfer E and q along [0K0] for a) pristine GeTe and c) Ge0.92Sb0.08Te crystals with TA and LA branches. The solid circles in (a) were determined by the multi‐peak Gaussian function from panel (b), and the red dashed lines are guides to the eye. (b) and (d) show phonon energy spectra for energy scans along [0K0] with a constant Q of k = 1–1.5 for GeTe and Ge0.92Sb0.08Te crystals respectively. The open symbols represent the data collected from the triple‐axis spectrometer of SIKA, while the solid lines in (b) are numerical fits with a multi‐peak Gaussian function, and in (d) are guides to the eye.
