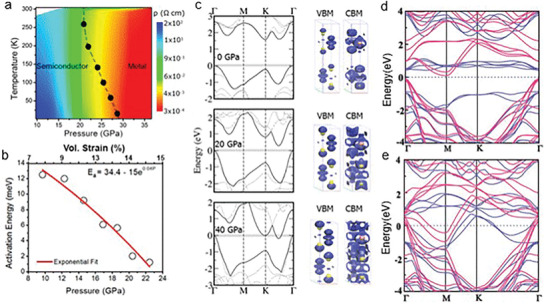
Figure 6.

Pressure‐induced metallization. a) Temperature–pressure contour plot of resistivity under various pressure, showing the phase transition from semiconducting to the metallic state. b) Arrhenius curve demonstrating the emergence of the metallic phase at a pressure beyond 22 GPa. c) Calculated band structure at 0, 20.4, and 39.5 GPa, showing that the bandgap approaches zero with the increase of pressure. Moreover, a complete metallization was observed at 39.5 GPa. d,e) The calculated band structures of 2D VS2: under ambient pressure and 18.68 GPa. a–c) Reproduced with permission.[ 17 ] Copyright 2015, American Chemical Society. d,e) Reproduced with permission.[ 11 ] Copyright 2017, Wiley‐VCH.
